Subsystem "Asset Management"
The wave structure, what method
are you using or whose theory?
And if you can be more specific.
Интересно.
Brief but succinct. :о)
Reread my post and realized that it should have been nicely rewritten or removed altogether. I was in too much of a hurry and ended up crumpled up and clumsy. But never mind. Such a universal subsystem is really interesting (at least two of us are interested in it :), but only for Expert Advisors, which have a clear forecast, at least in some way, for example TP and SL.
Maybe I haven't looked at everything on the forum, but mostly the use of Markov chains (CM) is suggested for predicting the quoting process. Not a mathematician, but in my humble understanding such an application makes no sense at all. CMs in general are far from processes of this nature. And more often than not, talk treads around the transition matrix rather than the model of the process itself. The states and transitions between them are an important element, but not the most important.
Apparently, the CM will help to solve the problems of optimisation of the route itself by orders (their choice taking into account the probabilistic nature). And it seems that the properties of this "macro-process" are very much like those of the CM. In addition, there are all sorts of subtleties - for example, the forecast showed strong movement in the future (not now). And in this case it can make sense to refuse a large number of deals on other instruments now and focus the resource (deposit) on the expected movement. If the strong movement is confirmed - the program will be full. If not - the SL will be triggered which, again, may be more acceptable than some of the SL orders triggered in the alternative.
But we can hardly extend optimization in full and include (or at least just consider) the trading environment of the DC. Elements of linear programming will probably be needed here.
"Well it's so kA-A-A-tsa..." (C)
to sator
Wave structure, by what method
do you use or whose theory?
And if you can be more specific.
I have discussed the concept of the system and some of its components on a closed forum. Now, I'm not ready to talk about it openly. The theory is completely mine.
Interesting. I'll have to read it carefully at home tonight.
And invite those who have something similar developed to discuss...
Interesting. I'll have to read it carefully at home tonight.
And invite for discussion those who have developed something similar...
I didn't manage to solve my problem, described in the first post, but it turned out to be not so trivial. In general, I am thinking.
But as an optional study of Markov chains and a better understanding of them, you can try to develop a subsystem for wave structure prediction. Predicting price directly with them makes no sense, but we can approach it differently - isolating states, if I may say so, of a higher order.
I don't think it's an entirely new idea to take a zigzag as an alternative. Next, collect the statistics of the parameters for the zigzag segments. The first thing that comes to mind is the length of the segment, its projections on the X and Y axes (time and spread, respectively), perhaps the areas formed by the chain of segments. On the basis of statistics develop rules of classification. As a classification criterion, you can take statistical frequencies and go over the zigzag again, at the same time doing a classification of each segment.
In fact, each selected class of a zigzag segment will be its state. According to first approximations, there should be from three to nine such states. Proceeding from statistical frequencies, intervals for each parameter should be selected in such a way that the resulting values of frequencies would be significant and differ considerably from each other. Then it will be easy to make a graph of states and calculate the transition matrix between states. So far intuitively, but it seems to me that only the current segment and the one following it can be predicted with the help of the CM.
Having got all this, we can already draw some conclusions concerning an acceptable strategy or at least get a statistical notion of situations when it would be better not to trade. If it works, it will be possible to get a more advanced forecast model, say, an empirical formula of mathematical expectation of future class or something like that.
Each state of the segment will limit its completion to some area. What is important is that the classification used would allow us to proceed to estimate the projection of the predicted segments on the X and Y axes. It only remains to find the estimated point of local reversal within the delineated wave completion zone. And it can be calculated either by the method described above or using Murray levels.
It may be that this method of forecasting will give a good result that will be statistically proved without any fancy tricks. It's like before you try you will never know.
was on the net somewhere
to Prival
Найдете вот это, все остальное что Вы написали, очень легко приложиться
Prival hi! You must have forgotten your old opponent :o) But never mind, I'll survive the diplomacy:
Your attentive look should not have escaped the fact that I am trying to master Markov chains and linear programming for slightly different purposes, namely asset management, i.e. finding and selecting the best trading decision, rather than forecasting itself. What I've proposed is a kind of study of the theory within the framework of optional development. And I detect pivot points in a completely different way, as I wrote and demonstrated above.
And as for "everything else will fit" - you are very much mistaken. Just refer to the wisdom of the ancient Chinese and my observations :o): You will never find a black cat in a dark room, especially in those moments when it is not there. Rely on me completely in this expert assessment - I have a black house cat and believe me, I know what I am talking about. :о)))
to njel
Yes, I know this product and have an idea of the logic by which it works. Erase it from your computer and do not use left and right wave theories at all. Use only your own.
But thanks for the picture, very nice. I like it very much as an artist. :о))
In my opinion it is not necessary to look for common approaches - optimization theory, Markov chains
The main reason for this is that the choice of the asset is not a problem of the company's own making.
Markov chains are the key to prioritize.
I have a similar task, although I haven't got to the details yet, just a bit.
I've been thinking about how to decide.
Suppose we have a set of financial instruments (assets) and signals for each tool. The signals are valid for some time, for example, they are generated at opening of a daily bar and remain valid until the beginning of the next bar. An entry point is searched inside the bar for each symbol according to the signal. If there are several signals at the same time
for different symbols at the same time, which one should be given priority? The one
The first one? Or to wait for the one with the higher probability of the favorable outcome?
I think that it is necessary to collect statistics for each instrument separately and then according to
I will use these statistics to try to look for some optimums.
somewhere on the net
This is a statistical prediction of the N bars ahead of the MA movement (smooth dashed lines to the right of the last bar)
and a statistical value of the boundaries where price is most likely to move (vertical dashed lines
lines next to each predicted bar for the fast MA)
- Free trading apps
- Over 8,000 signals for copying
- Economic news for exploring financial markets
You agree to website policy and terms of use
The problem, which I propose to talk about, has been discussed repeatedly at this forum, in its various manifestations, and various approaches to its solution have been proposed. I return to it again, but already adding certain specifics.
Terminology conventions
Before explaining the situation and asking questions, I will make a few reservations about the use of some terms. There is a whole science - "asset management", which successfully combines such theories as risk management, capital management, investment management, choice theory and many others, but carries the specifics inherent in enterprises and banks. The theory assumes a broad interpretation of the very concept of "asset", however, this is not so important. Without spreading my thoughts along the tree, I will say that I liked the term, and the most general approaches of this theory have some commonality with trade. But that's not the point.
The terms “wave flow” and “wave structure” used further in the text are similar to the term “zigzag”, more precisely, their differences do not affect the issues under discussion.
Formulation of the problem
At first glance, the task statement is very simple - to group the functionality of optimal planning, execution and control of trading operations in a separate subsystem, taking into account risk assessment and existing restrictions, such as available deposits and trading rules of specific DCs. Such an idea arose on the basis of the assumption of possible standardization of input data and a good separation of the variety of trading strategies from the statistical properties of their behavior.
The subsystem (or module) discussed below as a component of the expert is “Asset Management”. For greater clarity of representation of the functioning of the entire system, he resorted to the artistic power of the pictorial word. The picture below shows the interaction of processes and the main information flows. It is clear that the process will subsequently be packaged in some kind of module, and therefore, further in the text, I will not closely monitor the use, in general, of different concepts of “process” and “module”. It doesn't matter how important it is now. By design, the picture is more likely to refer to arbitrary notation, but I tried to adhere to IDEF. I am not yet considering the technical implementation and requirements for data formats, I would first understand what I want. And I want at least this thing (conceptually, the working documentation is still a little more complicated):
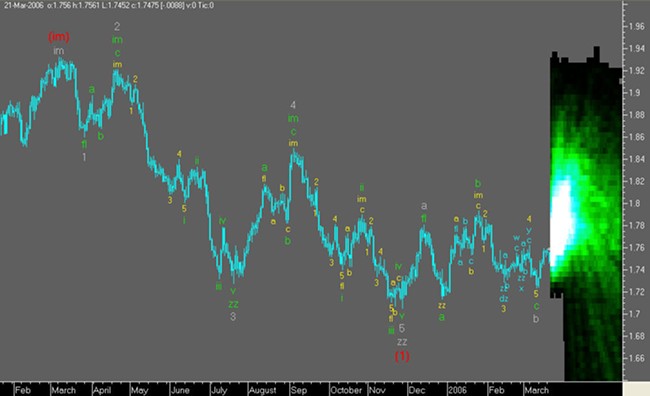
A few words should be said about the forecasting system, although it is not the focus of this topic. The development of the Wave Structure Forecast subsystem is divided into three main stages, and since the first stage has been recently completed, you can already see how it all “should not work” :o). Forecasting is demonstrated on the example of a "laboratory rat": EURUSD, hours, (H+L)/2. Fact is marked in black, future readings are in pale gray, and combined zigzag is marked in dark gray, built after the fact with “attached” segments of the calculated future wave movements:
It is too early to trade with such a forecast, but it is not planned yet - work on the subsystem has not been completed. The next development steps will add accuracy, better resolution, and more robust predictive levels to the forecast. Perhaps, the time of completion of the waves will be more accurately determined. With regret, we have to admit that MathCAD is not the best tool for descriptor graphics, and even more so for animation, so it turned out the way it turned out. Not all information about the forecast is displayed.
Next, I will describe in detail the information flows between the expert's processes:
Forecast by instruments . It is assumed that the subsystem receives, as input data, a forecast of the movement of the instrument in the form of a sequence of local extremums (in other words, a ZigZag), containing the calculated levels of the instrument and the time to reach them. The appearance of the universal forecast for the instrument is presented as follows:
The vertical dotted line represents the "now" position for each tool prediction. At the moment, the waves marked in black are already a fait accompli. The forecast includes waves starting from "A", "B", "C" etc. Wave "A", highlighted by a dotted line, refines the final wave of the ZigZag built according to history. There can be two options for it: either the forecast assumes that the wave is completed and its top is historical data or the wave will still develop, reaching some new level in the future.
In general, this is not important, but it will need to be taken into account when moving between coordinates when implemented in MT. The waves highlighted in pale gray continue the forecast of the instrument development, receding into the future.
Trading instruments . Everything is clear here: operational data for each traded instrument is transmitted to the subsystem, which can theoretically be used to control and modify transactions if such procedures are performed online without using SL and TP levels.
Number of predicted waves . For the module under discussion, this parameter can be obtained by counting the number of waves in the input. In other words, this parameter is set at the global level (outside the developed module) and mainly depends on the quality of the forecast for each forecast wave number (forecast depth level). I note that by setting the quantity equal to one, the system, in fact, will specify only the current extremum, i.e. extremum of the currently formed wave. It is assumed (at least it is my intention) that the number of predicted waves can be any value. But for now, I limit the wave flow forecast to a few waves.
DC restrictions . A set of trading environment parameters specific to each specific DC. The parameters are listed. I can’t say for sure yet that this or that parameter will be needed in the asset management model, but let them be an eyesore for now:
Maybe I forgot something that is intuitively useful? :about)
Wave structure statistics for each instrument . Important statistical information that may be useful for risk management:
Asset management model . This is where the snag is, it is clear that such a model should be, but so far I don’t quite understand what exactly it should be.
Basic functionality
The functionality is not yet structured, but is given as a general list, without any processes, relationships and logic.
Clarification of the end of the wave
The task formulated in the title is generally related to obtaining information on the basis of which final trading decisions will be made, for example, the most obvious is the calculation of SL and TP levels. There are two fundamentally different options here:
For now, I stick to option 2. Such an assessment can be made based on the calculation of the wave completion zone and the “point” assessment of the wave completion inside this zone. The zone itself can be calculated in different ways, for example, using forecast and actual error statistics. As a gradation of such a zone, one can take the mean square error. There is another way, at least my model allows you to make an alternative estimate.
A point estimate of the completion of a wave inside the zone can be obtained based on the search and analysis of extreme points, using the principles outlined in the following articles:
- 'One way to build support and resistance levels'
- 'Display support and resistance levels'
The picture below conditionally shows the areas of functions, designated as X and Y, limited by the size of the zone. Such functions can be the “density by levels” of the instrument or the frequency estimate of the lengths and lifetimes of wave segments. In one case, you need to adhere to the minimums, in the other, respectively, the maximums in these zones:
Thus, the data structure describing the predicted wave flow finally takes the following form: estimates of the wave movement completion zones are added, and a point estimate of the instrument level inside each zone:
Calculation of the trading plan
The “asset management” subsystem, in accordance with some regulations, will receive forecast data for each instrument: after sending a forecast request signal, each instrument will receive zigzag forecasts with probabilistic (frequency) characteristics of the constituent segments at the asset management input. In fact, it is required to find the most optimal "route for concluding transactions", taking into account the level of the deposit, current transactions, their correction, risks and restrictions of the DC. In other words, perform a "certain" calculation of a "certain" plan of trading operations (so far so "foggy"). The criterion for optimality is also a serious issue, where is the right balance between profit and risk. :about)
It also becomes clear from the above that the plan of trading operations in the general case may differ from the initial wave process (zigzag). Such a situation can arise not only due to the procedure for refining the completion of waves, but also, for example, when crossing the zones of rms termination errors, as shown in the figure below:
In the described case, it may be necessary to correct transactions (rejection of an intermediate transaction) or, as a response, there may be a decrease in the lot on this part of the route. It's hard to say for sure, suddenly studies will show that such small zigzags are the most statistically stable and it makes sense to set a larger number of lots on them - so far, everything is very theoretical.
In the general case, on the basis of a trading plan, it becomes possible to plan, in some way, “cash flows”. Of course, this makes sense only for strategies based on (or near the basis of) a forecast in one form or another.
Execution of trading operations
Much will depend on the specific logic of processing the trading plan. Intuitively, it seems clear, but more detail is required.
Availability of service functions
This is the general name for the specific features that arise when trading in automatic mode in the MT environment. The first thing I remembered:
Colleagues, if you have something to add (for the company), write, otherwise I don’t really understand in MT.
What am I asking about
I tried and I hope the above is less clear. Or maybe you can use:
It seems to me that, based on the theories and approaches selected from the whole variety, it will be possible to develop a very effective universal asset management module that can really maximize profits (or minimize losses, it all depends on the definition of who an optimist is). Is it so? Maybe someone has already gone down this path and can shed some light on the situation.
And the eternal question, if it is possible, then how?
Not a specialist in the field of mathematics, but some thoughts on the use of Markov chains have appeared, and I will try to voice them in the near future. As for mathematical programming, there is a complete layman, and even while I have not read anything, everything is still ahead. But as a reference for those who may not know at all what mathematical programming is, here is a general quote:
Линейное программирование – целевая функция линейна, а множество, на котором ищется экстремум целевой функции, задается системой линейных равенств и неравенств. В свою очередь в линейном программировании существуют классы задач, структура которых позволяет создать специальные методы их решения, выгодно отличающиеся от методов решения задач общего характера. Так, в линейном программировании появился раздел транспортных задач.
Nonlinear programming - the objective function and constraints are non-linear. Nonlinear programming is usually subdivided as follows: Convex programming - the objective function is convex (if the task of its minimization is considered) and the set on which the extremal problem is solved is convex. Quadratic programming - the objective function is quadratic, and the constraints are linear equalities and inequalities.
Multiextremal Problems . Here, one usually singles out specialized classes of problems that are often encountered in applications, for example, minimization problems on a convex set of concave functions.
If the correctness of the chosen approach is confirmed in the process of laboratory research, then the next logical step will be the development of technical specifications for the development of a "linear programming system" to be implemented. I do not exclude, and I hope that the designated topic will be of interest not only to me.
Good luck to everyone and passing zigzags :o)))