[Archive!] Writing an advisor for free - page 86
You are missing trading opportunities:
- Free trading apps
- Over 8,000 signals for copying
- Economic news for exploring financial markets
Registration
Log in
You agree to website policy and terms of use
If you do not have an account, please register
Observe. I want to put in the calculation of the macd histogram, the calculation of the RSI values.
This is done simply, 1 line changes.
I need to show RSI values (12).
Why 2 histogram columns under 1 candlestick? Because I want the 2nd bar of the histogram to show the RSI values (37). And their crossing, RSI-1 and RSI2, should be indicated by an arrow under the candlestick.
Or maybe you can use 2 colours for 1 column of the histogram? One rsi1, the other rsi-2?
Thank you.
MoNk2011, did you notice that the first post in this thread was written three years ago? That person hasn't been here for a long time.
And second: if you want to draw attention to your request, try to interest others in some way. For example, tell them about the advantages of this system. And better - show the results of trading on it (since there is no EA).
Otherwise, you will have to wait a very long time to get it "for a fee".
Hello! Please help me write an EA for testing!
Here you go. This version of the ForexBomber Expert Advisor is for the tester only!
The more you set the Lots parameter, the faster you will end up in the sewer! :DD
Hello Dear Traders. Please help me upgrade my EA based on 2 moving averages crossover. Found a good combination of fast and slow moving averages. 50 and 7 on half an hour. I have tested it on 10 months of quotes history, and the result was good. But it may be improved by false cross filtering. For this purpose we use Daily Pivot Fibo indicator. How to use it as a filter:
Let us have a look at the picture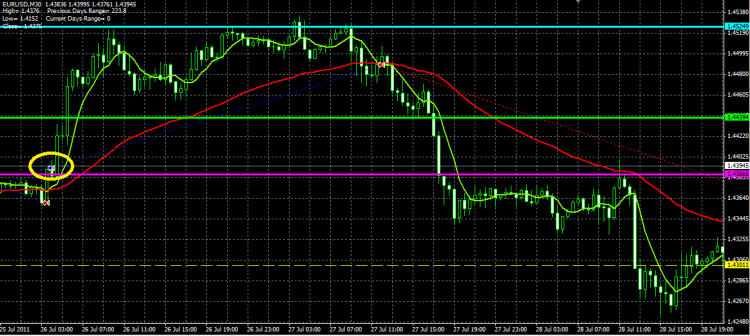
Suppose the Expert Advisor opened a buy position, the price goes in the right direction, reaching the first resistance level (shown in green) we need to close the trade, as the price can go in the other direction, as shown in the next level (shown in blue). But in this case the price breaks through the level. And in order not to lose the opportunity to earn more, we put pending order at 10 points above the given level, as we see it would work. Again we close the deal at the next level. As we can see we were very right, as the price has gone the other way and we do not lose profit. We open the next bet only at the next cross and again we close at the levels following the price in the same way. Some clarifications on closing and opening trades:
We close and open trades at about 10 to 15 points from the resistance line at closing prices of the candle. The Expert Advisor should place take profit and pending orders at levels (of course, with 10 to 15 points before the resistance line and after it, for a pending order). If the price after breaking through the level does not reach take profit and after it turns around and the muvings have already formed crossing to another side, the bet is closed with loss and a new one is opened. That is all. With this filter you can have much bigger profit and smaller loss.
Here is the trading history: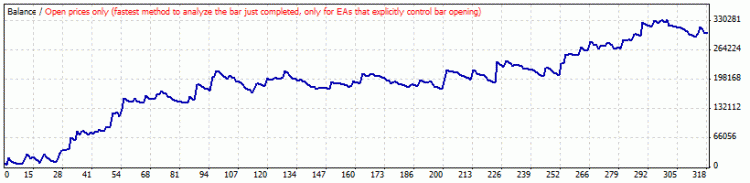
The Expert Advisor itself:
Here you go. This version of the ForexBomber Expert Advisor is for the tester only!
The more you set the Lots parameter, the faster you will end up in the sewer! :DD
Please add the possibility to set take-profit and stop-loss!
And I thought the results of the tester had reassured you...
Here you go. Added TakeProfit and StopLoss. Parameters are specified in points.
Plus, I added four more parameters (to play with and calm down):
1). MoreOrders <--- Allow or prohibit re-opening of an order in the direction of the expected trend;
Explanation:
а). MoreOrders = True ---> Three indicators are "green", the position was opened. A close condition triggered, we closed the position. Three indicators are green again (maybe the uptrend continues and it was just a correction), we opened a position again;
б). MoreOrders = False ---> The position will not re-open. The Expert Advisor will wait for the change of the trend to the opposite, when all indicators become "red".
As well as the parameters that are responsible for the conditions of closing the order:
2). Closeforstrag10 = True <--- if the histogram forstrag1 with the period 10 changed its colour to the opposite, then close the order;
3). Closeforstrag55 = True <--- if the histogram forstrag1 with the period of 55 changed its colour to the opposite one, then close the order;
4). Closevarmov = True <--- if the varmov curve with the default settings has changed its colour to the opposite, close the order.
If these three parameters are set to False, the orders will only be closed by StopLoss or TakeProfit.
Hi.
I trade with my hands according to the TS, but not systematically. for this I need to write an owl. I have found a person who has written an owl, but he does not want to do it the right way, or he does not want to.
I have found a person who has written an owl, but he has deviated from the algorithm.
In general, please look at the ToR and tell me how it is realistic to implement.
For me, it looks like the owl with pending orders and variable levels.
my respect.