You are missing trading opportunities:
- Free trading apps
- Over 8,000 signals for copying
- Economic news for exploring financial markets
Registration
Log in
You agree to website policy and terms of use
If you do not have an account, please register
The thing is, this bug doesn't last long and you have to "catch" it, and the expert is showing on its face!!!

KimIV wrote (a) >>I think you need to get busy catching your bugs yourself.
I completely agree about my bugs...., but there is a problem in the script!
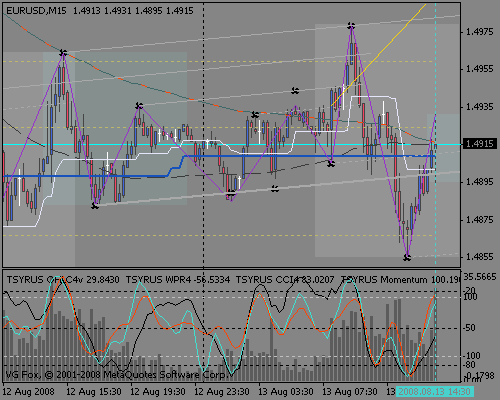
You can see the problem in the picture with the script's puten overlay on the M15 chart!!! (what is the point for me to cheat)
The second figure with the EA is one line, all the functions and code are yours.
Understand correctly - I don't want to debug/write the EA at your expense, it's for showing the issue.
WHILE RUNNING THE EXPERT since January 2008 on M15 - you can see the "TURNS" of the trend !
here's your August, you just need to run it longer...
What needs to be run? Explain clearly, where are you pulling the bug from, which arm?
You can see the problem of putting the script on the M15 chart in the picture!!! (what's the point of me cheating).
I do not have it. Maybe you have something wrong with quotes? >> Data inconsistency...
I'll explain in order: The bug appears when using the script - very difficult to catch!!! the figure is coloured I sent.
When using expet (data uploaded from Metaquotes all TF!!!!) the trendline jumps - drawings are b/w.
For example Тf-M15 from August 11, 2008 (see picture) - trend indicator "went up" and I stopped the tester, made a picture, went further - trend indicator began to show normally, then after some time again "went away" from extremums and so on.......
The dressing down is, in my opinion, a visual testing of the Expert Advisor on the data - we can observe visually how the trendline sometimes reaches right extrema, sometimes it does not reach the last extrema. (the speed of visualization of testing is maximal - the jump effect can be better seen)
But what about you - does it really draw the right trend lines all the time? I've been testing on your interval - month of August - the same thing is happening on other timeframes and timeframes. The smaller is the timeframe, the more often it "jumps".
the clip file is in the archive...
To KimIV
I have noticed that the "spike" starts for the up trend when Bid becomes equal to the value of the last extremum ZZ !!!
That KimIV.
The GetExtremumZZZPrice function works incorrectly when the price equals the value of the last extremum ZZ and gives the value of the previous extremum.
P.S.
If you are still watching my posts...please let me know... :)
To ALL
Who else is interested:
A BUG has been found in the function double GetExtremumZZZPrice ! Instead of i=1 write i=0 . AND ALL WORKS LIKE CLOCKWORK!
correct code:
double GetExtremumZZPrice(string sy="", int tf=0, int ne=0, int dp=12, int dv=5, int bs=3) {
if (sy==" || sy=="0") sy=Symbol();
double zz;
int i, k=iBars(sy, tf), ke=0;
for (i=0; i<k; i++) {
zz=iCustom(NULL, 0, "ZigZag", dp, dv, bs, 0, i);
if (zz!=0) {
ke++;
if (ke>ne) return(zz);
}
}
Print("GetExtremumZZZPrice(): Extremum ZigZag number ",ne," not found");
return(0);
}
THIS IS ALL!!!!!