You are missing trading opportunities:
- Free trading apps
- Over 8,000 signals for copying
- Economic news for exploring financial markets
Registration
Log in
You agree to website policy and terms of use
If you do not have an account, please register
2 solandr:
Maybe they just hide the fact that they are billionaires ;))
I think they already have such an EA written somewhere, I am too lazy to write it myself.
2 ExpertTrader:
It seems to me difficult to write an Expert Advisor based only on Alligator, because the computer still needs to explain how to clearly identify the trend (yes, there is Gator, but there you can only talk about a corridor compared to trends, which means you have to analyze the history, etc.).
If we do it the way Billy describes, then it is the same whether the Alligator's jaw is wide open or not, and the signal for entering is fractal penetration, and then apply other measurements.
In general, it is difficult not to agree with Bill's arguments (psychologist, after all =)))
How do you see a bar as a tool? Like "Close price is less than open price"? Is it possible to get something definite out of a bar? On the other hand, a sequence of bars is more than one bar. And "considering some fractality of the market" (I would say non-linearity of the market) Williams just developed Fractals.
I think that if you strictly follow Bill's proposed strategy, the profit should be there. (If you look at the quotes history, it seems to really work). Unfortunately I tried it little on demo, but maybe someone will confirm, that it's true (or refute it ;( ).
well, what's a bar not a tool? Closing less than opening, shows highs and lows for the period... for example :) . But that's not the point at all. When you develop a strategy, it's not just the result of running it that counts. The lion's share of all working systems is represented by the ones that are out of date. Tell me how many strategies you need to generate, so that on history, they would give you profit, and I will generate them for you. 5 quid per strategy. if more than 100, then + 5 strategies for free.... If you have more than 100, you get 5 strategies for free. There is nothing to complain about, because everything is logical. What is the basis of Williams' theory? Well, fractals, so what?
Here's what I've come to in the meantime.

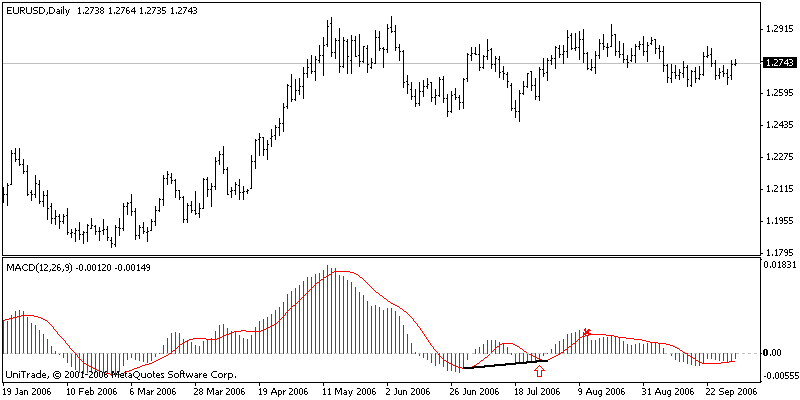
I suggest to use MACD.
Signals:
1. Buy: When the indicator crosses the signal line from bottom to top, the trend, defined by the same indicator, should be directed upwards. The trend is plotted based on two points: from the previous signal to the current one (shown in the picture with a black line).
2. Close a long position: the indicator crosses the signal line from top to bottom (the signal line becomes higher).
Opening and closing of short positions is mirrored.
Simply genius! :o)))
This is what I have come to in the meantime.
I propose to use MACD.
Signals:
1. Buy: When the indicator crosses the signal line from bottom to top, the trend, defined by the same indicator, should be directed upwards. The trend is plotted based on two points: from the previous signal to the current one (shown in the picture with a black line).
2. Close a long position: the indicator crosses the signal line downwards (the signal line becomes higher).
Opening and closing of short positions is mirrored.
Right?
I came up with the idea when the test visualisation came out. I paid attention to the way price behaves within a single bar. Basically, you don't need to open a lower TF to see what is happening. Not always, of course, but very often. That's why I thought: what if I calculate the average price of the same ticks within one bar (any TF) and compare it with the bar reference centre (High+Low+Close)/3? Or better yet, compare it with the OC of the previous bar. The result should be an offset or a vector, where the price goes. The most interesting thing is that this vector can already be used before the current bar closes. Approximately, this is the idea. I have not had a chance to try it yet. I forgot all my business with the Championship, and now I have to catch up with it.
Give me your criticism. I'll be sure to experiment myself, as soon as I've got some rest. At the moment I'm using the daytime OC and its levels. Our ancestors were clever, I tell you! :) Therefore I will dig in this direction anyway.
Indeed, only experimentation can show the viability of the theory.
Send me a link to where to look.
The indicator is built using three moving averages. If you plot those MAs on the chart you will get something similar to the Alligator.
1. If MA Close is higher than MA (H+L+O+C)/4, while MA (H+L+O+C)/4 is higher than MA Open - BUY.
2. If MA Close is lower than MA (H+L+O+C)/4 and MA (H+L+O+C)/4 is lower than MA Open - SELL.
If MA Close is higher than MA (H+L+O+C)/4 - CLOSE.
4. If MA Close is lower than MA (H+L+O+C)/4 - CLOSE LONG POSITION.
The Indicator shows these signals using two lines:
1. The green line - shows buy/sell signals. If zero line is crossed from below to above - BUY, from above to below - SELL.
2. The red line indicates signals for closing a position. At zero line crossing from below upwards - CLOSE SHORT POSITION, from above downwards - CLOSE LONG POSITION.
Indicator parameters:
1. period - period of averaging for moving average calculation.
2. ma_method - averaging method. Can be any of values of Moving Average methods.