Coloring the background of the RSI
Hi,
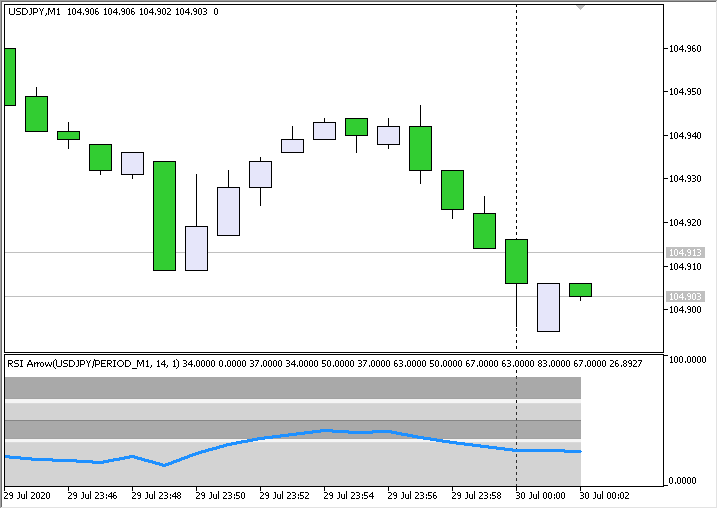
Could someone tell me what lines should I write into the basic RSI indicator's code to get the result on the pic?
At moment I draw rectangles to get the colored zones. Basically I want colored zones at the backround of the indicator regardless of the timeframe.I hope it's not difficult.
Thanx.
Describe more precisely what is the rule for drawing rectangles?
Describe more precisely what is the rule for drawing rectangles?
Just to separate certain levels. For example let the zone from 50 to 85 be dark grey, the zone between 34 and 37 white...etc
At the moment I have to draw rectangles filled with color to get the result.
If u want these are the zones I'd like to see:
from 0 to 34 light grey
from 34 to 37 white smoke
from 37 to 50 dark grey
from 50 to 63 light gray
from 63 to 67 white smoke
from 67 to 83 dark grey
Is it possible to write these numbers out at the side of the indicator as it does when I add a level?
More or less like this?
More or less like this?
It's almost perfect! :)
2 questions:
1, Can the coloring fill the whole area? I mean over the chart shift line?
2, Could you move the zone level values to the right side of the indicator where the 0 and the 100 are. And get rid of the zeros behind the dots?
btw... I don't know how to thank you up to now! :)
version "1.001"
version "1.001"
yeah.. I could've thought to add lines to see the levels... silly me :D
So it isn't possible to extend the colored area over the chart shift till the right side of the indicator to fill the empty space?
yeah.. I could've thought to add lines to see the levels... silly me :D
So it isn't possible to extend the colored area over the chart shift till the right side of the indicator to fill the empty space?
I tried several options - using graphic objects. But unpleasant nuances always came out - so I decided to stop at the current solution.
I tried several options - using graphic objects. But unpleasant nuances always came out - so I decided to stop at the current solution.
No worries mate! It's already more I hoped for. Great work!
Thank you very much and I wish you a happy new year!

Sorry but I can't see the difference :(
What's new in it?
- Free trading apps
- Over 8,000 signals for copying
- Economic news for exploring financial markets
You agree to website policy and terms of use
Hi,
Could someone tell me what lines should I write into the basic RSI indicator's code to get the result on the pic?

At moment I draw rectangles to get the colored zones. Basically I want colored zones at the backround of the indicator regardless of the timeframe.I hope it's not difficult.
Thanx.