Linear Regression with Offset, Indicator Not Loading, Please Help
Dear Forum,
I'm attempting to utilize linear regression in order to trade. Specifically, I want to be able to use offsets with linear regression, in order to predict with the probability model.
I'm trying to calculate the Linear Regression with the Least Squares Method. MT4 does not have a linear regression curve.
I've attempted to build the indicator, and have resolved all the errors. Despite the code being error free, it still is not plotting any curve when I attempt to place it on my chart.
Does anyone know why my indicator is not loading onto my chart in MT4? I greatly appreciate any advice you can give me. Please see the indicator attached.
By the way, I think Linear Regression/Least Squares Moving Average is the only Moving Average capable of predicting, producing an output with negative offset.
Many traders speculate with a positive offset, the positive offset is shifting the moving average curve to the right.
The negative offset shifts the curve to the left, which leaves a void in most instances as there is no data... but with Linear Regression, the probability model continues to output.
It seems useful in terms of filtering out bad trades on small timeframes.
https://www.mql5.com/en/code/8016
My advice is to use parabolic regression
I'm grateful that you told me to consider parabolic regression, maybe that's an extra element I should add to my game.
I do appreciate your reply. That said, I'm looking for something similar to that, but that plots the entire curve, and extrapolates from left to right.
The reference extrapolates backwards, from right to left. It uses i as the x variable, it also uses the same i, with no edit, as the historical y variable, as Close[i], meaning the curve is getting its y in the opposite direction as its x. When X is 1, it is using Close [1], which is the most recent close, and when X is 10, it is using Close[10], which is ten bars prior in the past. So the curve is interpreting the data backwards.
It doesn't appear to be a problem, because the curve uses the for loop to calculate the slope and y intercept from the summation of all those values, and then plots one straight line like a linear regression line.
I hate to be so picky, but I have to be careful about the way the data is extrapolated.

- www.mql5.com
I'm grateful that you told me to consider parabolic regression, maybe that's an extra element I should add to my game.
I do appreciate your reply. That said, I'm looking for something similar to that, but that plots the entire curve, and extrapolates from left to right.
The reference extrapolates backwards, from right to left. It uses i as the x variable, it also uses the same i, with no edit, as the historical y variable, as Close[i], meaning the curve is getting its y in the opposite direction as its x. When X is 1, it is using Close [1], which is the most recent close, and when X is 10, it is using Close[10], which is ten bars prior in the past. So the curve is interpreting the data backwards.
It doesn't appear to be a problem, because the curve uses the for loop to calculate the slope and y intercept from the summation of all those values, and then plots one straight line like a linear regression line.
I hate to be so picky, but I have to be careful about the way the data is extrapolated.
I understand the reason for your confusion. :))
But you can extrapolate a function (in this case a parabola) in any direction.
Zero is not the end. There is a plus on one side of zero and a minus on the other. :))
I understand the reason for your confusion. :))
But you can extrapolate a function (in this case a parabola) in any direction.
Zero is not the end. There is a plus on one side of zero and a minus on the other. :))
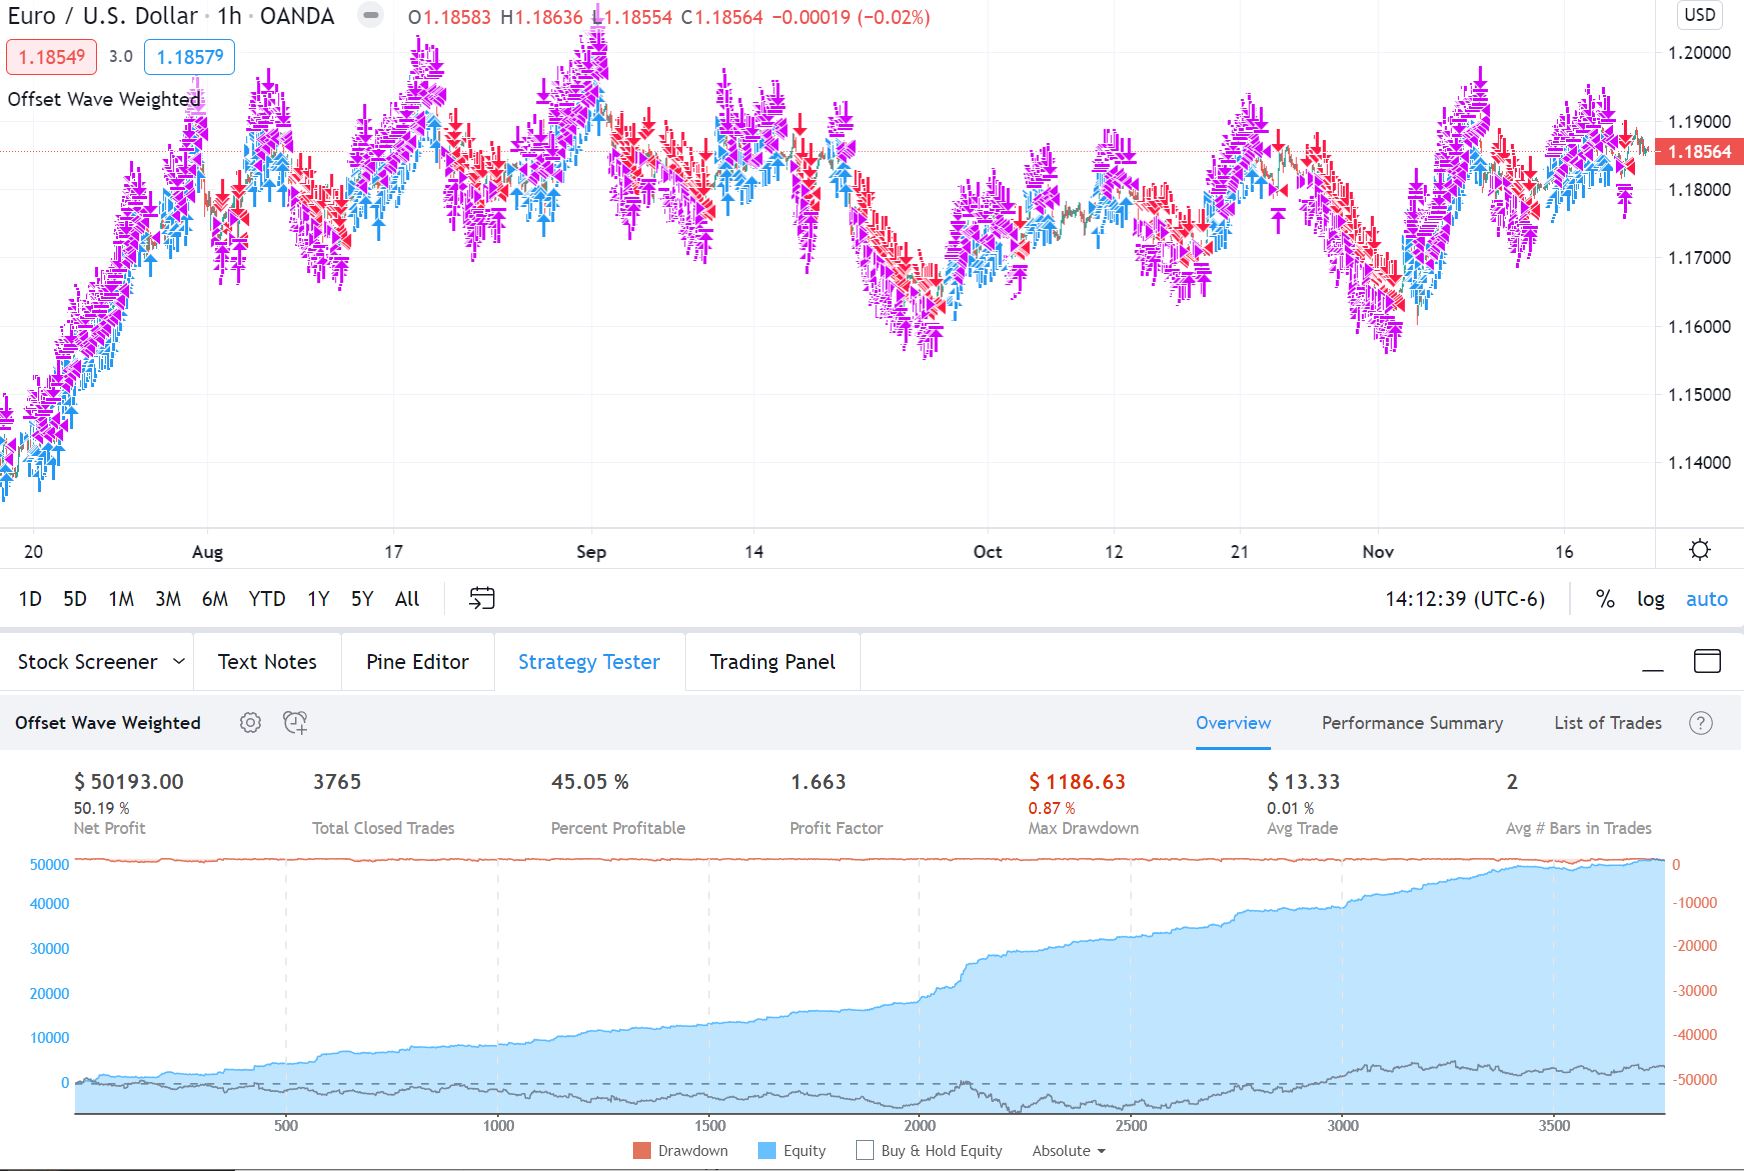
Ok, that chart is beautiful. I'm astounded you did this all in Metatrader! The Zig-Zag line seems like an excellent tool now.
Maybe I will give the formula another chance. I'm just trying to figure out how to configure my offset when I use linear regression.
I'm going through some of the Gauss Jordan equations, and backtesting. When I backtest, at least with an exponential to the power 4, I find it takes longer to calculate the exponent. It seems to translate to slightly better results though, even with less strict parameters. I'm going to move down to a lower power exponent, and experiment with Cramer's Rule, to see if I can improve the results.
Thank you for recommending parabolic regression. It does produce better results!
Appreciate your honesty and insight :)

- www.mql5.com
Ok, that chart is beautiful. I'm astounded you did this all in Metatrader! The Zig-Zag line seems like an excellent tool now.
Maybe I will give the formula another chance. I'm just trying to figure out how to configure my offset when I use linear regression.
I'm going through some of the Gauss Jordan equations, and backtesting. When I backtest, at least with an exponential to the power 4, I find it takes longer to calculate the exponent. It seems to translate to slightly better results though, even with less strict parameters. I'm going to move down to a lower power exponent, and experiment with Cramer's Rule, to see if I can improve the results.
Thank you for recommending parabolic regression. It does produce better results!
Appreciate your honesty and insight :)
I like the parabola because it is the most suitable function for describing the interaction between material objects (a parabola is the junction between a hyperbola and an ellipse (orbit)). And I am sure that gravity in the world of money works according to the same laws as in the material world.
Lol, yea maybe the 4th degree is too far.
Appreciate the chat!
Lol, yea maybe the 4th degree is too far.
Appreciate the chat!
Higher degrees can be used well for plotting moving averages with minimal lag.
https://www.mql5.com/en/forum/173057/page4#comment_14805702
- Free trading apps
- Over 8,000 signals for copying
- Economic news for exploring financial markets
You agree to website policy and terms of use
Dear Forum,
I'm attempting to utilize linear regression in order to trade. Specifically, I want to be able to use offsets with linear regression, in order to predict with the probability model.
I'm trying to calculate the Linear Regression with the Least Squares Method. MT4 does not have a linear regression curve.
I've attempted to build the indicator, and have resolved all the errors. Despite the code being error free, it still is not plotting any curve when I attempt to place it on my chart.
Does anyone know why my indicator is not loading onto my chart in MT4? I greatly appreciate any advice you can give me. Please see the indicator attached.
By the way, I think Linear Regression/Least Squares Moving Average is the only Moving Average capable of predicting, producing an output with negative offset.
Many traders speculate with a positive offset, the positive offset is shifting the moving average curve to the right.
The negative offset shifts the curve to the left, which leaves a void in most instances as there is no data... but with Linear Regression, the probability model continues to output.
It seems useful in terms of filtering out bad trades on small timeframes.