Which Moving Avarage (EMA) of the H4 is the best to detect retracement
I played with settings a little, found out a good looking one, but sorry i have forgotton what i did. :) You might find it too by change of the parameters...
Hi all,
Which Moving Avarage (EMA) Period breach of of the H4 is the best to detect retracements
Moving average will not show retracement,it will show "the average price for the period" the price can close above or below a moving average and this could be a general guide that the price is retracing, when the close occurs, look to see if price is using the MA as a support or resistance, also a lower MA would see price move quicker than a higher MA when using higher time frame charts.
The use of 2 moving averages is best used, a lower and higher, given you know about the crossing of MA's and what price does, use the lower ma to determine entry, on high time frames the crossing may not be very often and when it does, you cannot rule out the whiplash effect, hope this has been of some help.
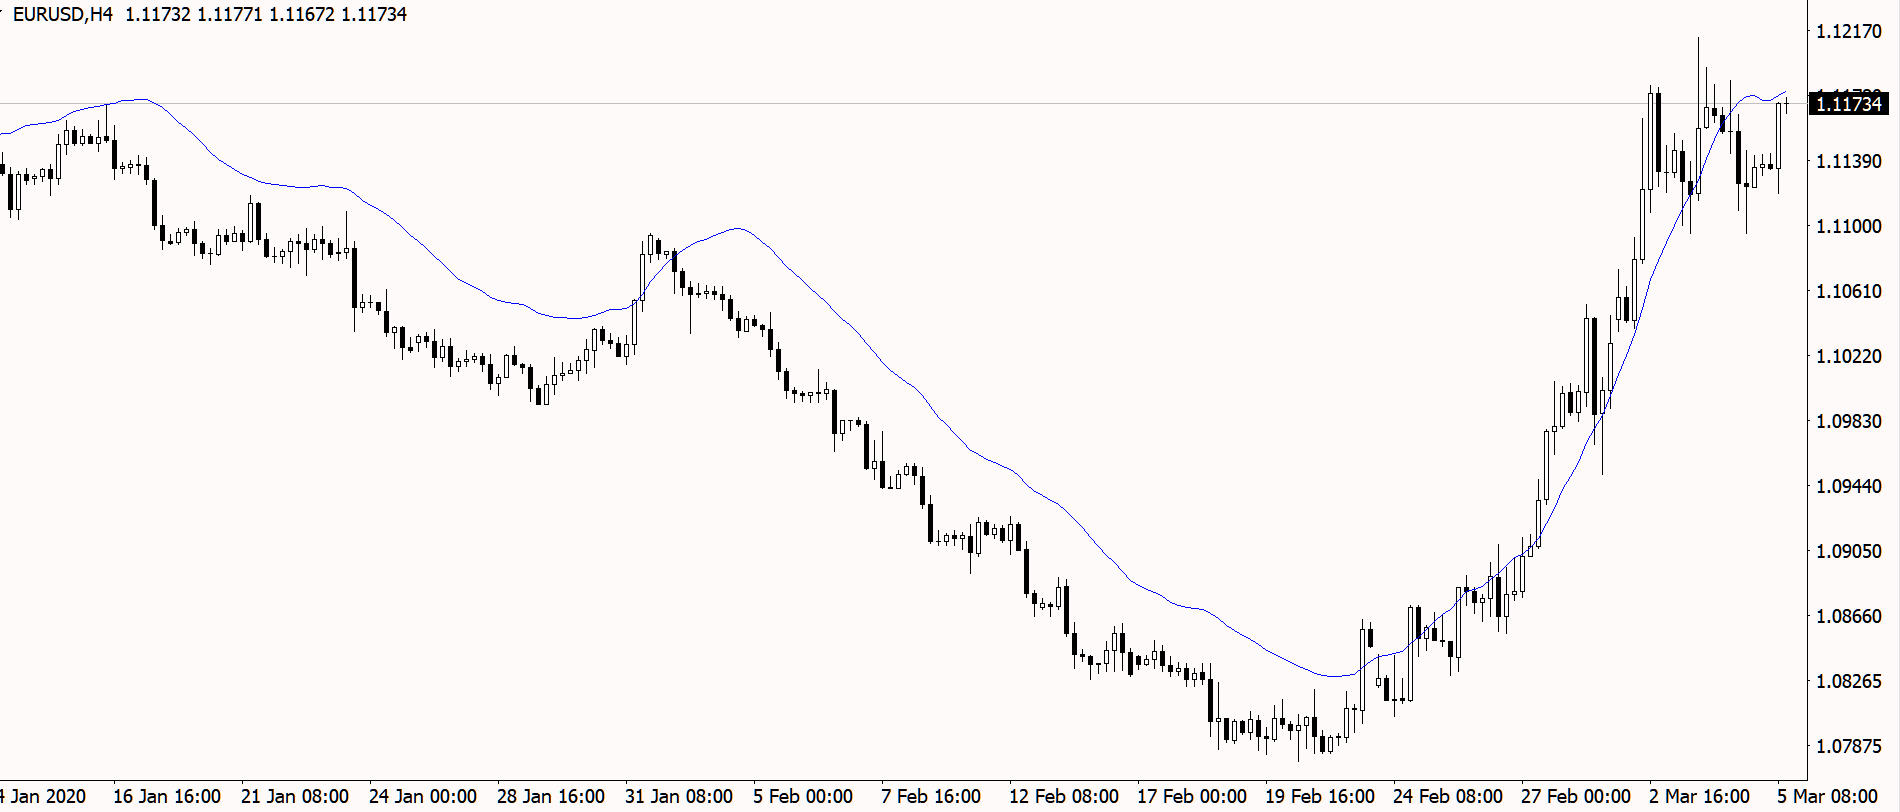
Below is a 100 simple ma white, 14 simple ma red, I have circled where price has closed inside the shorter ma then advanced towards the longer ma, notice how price closed between the two, with one showing price driving straight from one to the other in a single bar.
My only observation, these are 4hr bars, an attempt to trade this time frame would keep you in a trade for a long period before getting any results.


- www.mql5.com
Moving average will not show retracement,it will show "the average price for the period" the price can close above or below a moving average and this could be a general guide that the price is retracing, when the close occurs, look to see if price is using the MA as a support or resistance, also a lower MA would see price move quicker than a higher MA when using higher time frame charts.
The use of 2 moving averages is best used, a lower and higher, given you know about the crossing of MA's and what price does, use the lower ma to determine entry, on high time frames the crossing may not be very often and when it does, you cannot rule out the whiplash effect, hope this has been of some help.
Below is a 100 simple ma white, 14 simple ma red, I have circled where price has closed inside the shorter ma then advanced towards the longer ma, notice how price closed between the two, with one showing price driving straight from one to the other in a single bar.
My only observation, these are 4hr bars, an attempt to trade this time frame would keep you in a trade for a long period before getting any results.
You use 14, some people says 20 is the magic number what do you think about EMA20?
You use 14, some people says 20 is the magic number what do you think about EMA20?
The above was just an example of how price reacts and we can make use of it, are you using a single ma or multiple ones?
The same chart with 20ma, a few noticeable differences, one way of utilisation could be putting an order to open on the Ma, notice how the price eventually connects and advances, I suppose this kind of confirms your retrace theory, not something I would totally depend on for taking a position, it does look a very simple, yet effective approach.

The best way than uses moving averages to predict retracements is to use MACD. It uses the distance of 2 diferent moving averages, and you can look for divergences and convergences, or diferent crossovers, in order to predict retracements.
Moving average by itself can't show retracement per definition, you should use at least 2 moving averages like Rob Cain has shown.
The best way than uses moving averages to predict retracements is to use MACD. It uses the distance of 2 diferent moving averages, and you can look for divergences and convergences, or diferent crossovers, in order to predict retracements.
Yeah, better use, the MACD is an oscillator that incorporates Ma's, with a capped movement a retracement does not have to be infinitive, think the Ma debate is an old and priceless one, without going into astronomy, the Ma would be the oldest method probably ever used and still just as effective today.
One thing the Ma is good for because of it's nature is a trailing stop loss hence my approach on the previous post, (putting orders along the ma) being a lagging indicator it will only ever meet the actual price when it becomes, the actual ma price
- Free trading apps
- Over 8,000 signals for copying
- Economic news for exploring financial markets
You agree to website policy and terms of use
Hi all,
Which Moving Avarage (EMA) Period breach of of the H4 is the best to detect retracements