Duke's quantum analysis
What does a quantum graph look like?
Over a long time interval, it naturally resembles a regular chart:

However, we understand that this is not entirely true when we increase it a little:

And let's enlarge:

And now we see that everything is completely wrong. Now the internal structure of the quantum graph is clearly visible.
We see that the speed of price movement is constant, and only the direction of movement changes. All segments of the graph are oriented at the same angle. Oh yes, we are in a quantum world where the speed of light is constant.
For me, it’s so very beautiful. This is a personal, undistorted space-time exchange price. Well, quantum time is a very special song and we will definitely talk about it later.ABOUT QUANTUM TIME
Let's try to clarify how things are with quantum time. Take a regular chart and turn on period separators:

As we can see, period separators are located at the same distance, according to astronomical time. Everything is in order.
Now let's try with a quantum graph:

And what do we see? Everything is completely out of order. All intervals are different. When the market is active for a long day, and when
the holiday and stockists are resting, then very short. The time axis “breathes”, then expands, then narrows, adapting to the current
market dynamics.
So, as Munchausen said, time on earth and in heaven does not flow equally. And the speed of time is determined by the rate of change of the material parameter, in our case, the quantum price. Namely, due to its temporal plasticity, the quantum graph fits so precisely into the calculated quantum channels, in its natural habitat.
We will return more than once to the features of quantum time, but this is enough for our introductory conversation.
ABOUT QUANTUM CHANNELS
Gentlemen quantists!
Isn’t it time, my friends, for us to sway at quantum, you see, our channels.
The first and, in my opinion, the most important thing that follows from Dook's theory is that prices move through channels.
This is no longer an empirical observation, first made by Dow, but a scientific fact. Prices move on channels and only on channels and nothing else.
The second fact. The width of the channel and its slope are related by the Heisenberg uncertainty principle. In physics, this is formulated as follows: you cannot simultaneously accurately measure the coordinate of a quantum particle and its momentum. And this error, which cannot be eliminated in any way, is the embodiment of the truth of the unpredictability of our world.
Therefore, if we accurately determine the value of the price, then we do not know where it will move, up or down. And if we measure the speed of the price movement (channel slope), we don’t know where the price will be inside this channel.
The second option suits us quite well, since we will know the slope of the channel, and we will not be able to predict how the price will behave inside the channel. This is an acceptable fee, because we are more interested in the fact of price growth, and not in what way this growth will occur.
Of course, investors with one hundred dollars may not agree with this, since it is important for them how the price will rise,
because the holiday of life can continue without them after a small pullback. Well, there is no perfection in this world, although
there is consolation: it will be necessary to build channels rather narrow, in accordance with the available deposit. And
constantly monitor the market situation, quickly responding to its changes.
To be continued...

- 2019.10.29
- www.mql5.com
ABOUT QUANTUM CHANNELS 2
For the quantum price, as for any other quantum system, the Heisenberg uncertainty principle must be valid. The corresponding Duc uncertainty formula is:
Δ R ≈ qrn
Where:
Δ R is the uncertainty of the price coordinate in the Dook space,
q - a numerical coefficient equal to √2 for ideal input data,
r - value of price quantum
n is the quantum number .
Thus, it is very easy to calculate the channel width, because coordinate uncertainty is the width of the channel of the current trend.
Now it becomes real to predict the possible direction of further price movement by calculating the permissible movement channels. Let me remind you that in quantum systems arbitrary movements are impossible, but a set of valid options is possible, which are calculated by the formulas:

Where:
n α , n β , n γ, n abc - quantum numbers of allowable channels for future price movement,
R n - the value of the current trend,
n is the quantum number of the current trend.
Alpha channel directed in the opposite direction relative to the current channel, it always exists, since its radical expression is always positive.
However, this cannot be said of beta and gamma channels, the direction of movement of which coincides with the original channel. The expression under the root for certain combinations of parameters can be negative, which means the impossibility of the existence of these channels. In this case, a degenerate channel abc will be formed, the quantum number of which will be twice as large as the quantum number of the current trend.
So, when the price leaves the current channel, it cannot move arbitrarily. It has a choice of four channels, one of which with a turn in the opposite direction, and the rest in the same direction. but with a change in speed. The gamma channel is usually formed before a trend reversal.
To be continued...

- www.mql5.com

Dukascopy SEO Andre Duka
ABOUT QUANTUM CHANNELS 3
Quantum channels can be built both on a trend and on a pullback.
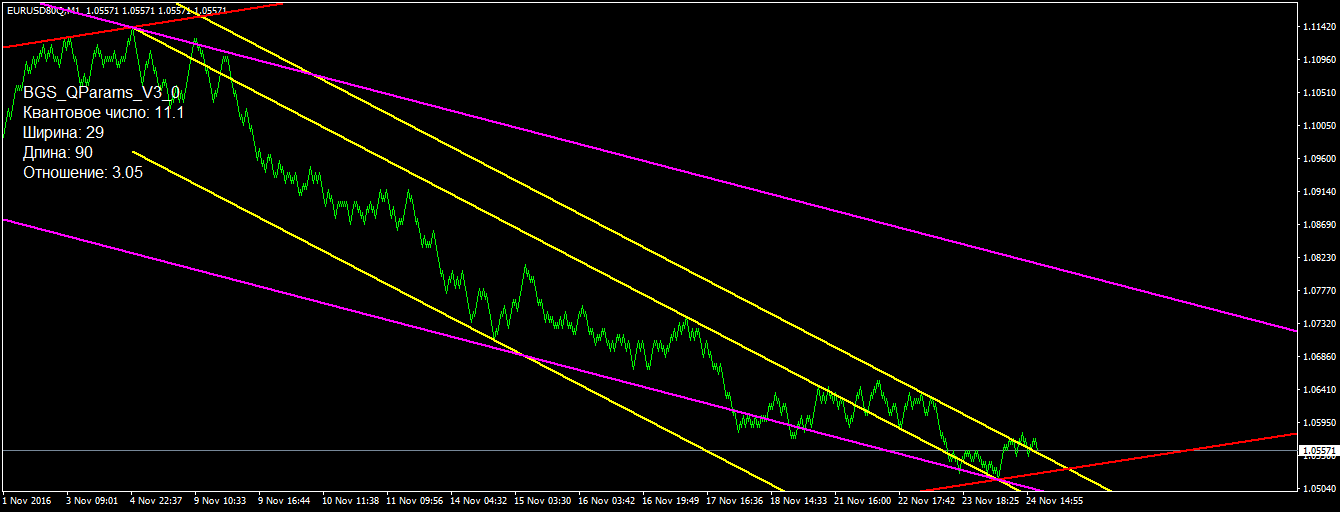
The first chart is an example of building on a trend.
The current quantum channel is drawn in yellow. Violet is the degenerate abc channel, and red is the alpha channel.On this graph we can see some interesting points.
Firstly, slowing down the rate of decline before correction. Toward the end of the trend, the price begins to demonstrate what it knows about the purple channel and uses it as a support line, although before that it had been decreasing in the yellow channel at a speed twice that.
Secondly, the “Ratio” parameter has already slightly exceeded the value of 3. This suggests that the correction has already matured. And the quantum price already demonstrates this by starting to knock on the resistance line of the yellow channel.
In this situation, a breakdown of the yellow resistance line usually occurs and correction to the resistance line of the violet channel occurs. Further, the price will continue to fall in the purple channel.
Before exiting the current channel, the quantum price tests the trader's patience by dragging the decision to where to go next. And until she drives herself into a corner between the yellow line of resistance and the red line of support, she, as a partisan, will never say where she will go.
I sometimes get the feeling that the exchange price, like a good poker player, is bluffing to the last, showing false swings and breakdowns, but, in the end, is forced to make a decision.
In order not to ruffle your nerves, you can put pending orders and go for tea.
I say orders because sometimes she pulls the trader with false movements, she suddenly breaks the red support line and quickly goes down. Therefore, we need a sell stop a few quanta below the red support line, and a buy stop a few quanta above the yellow resistance line.
A quantizer, like a hunter, must be able to wait, must know all animal paths (types of quantum channels), and put an appropriate trap on each path (pending order).
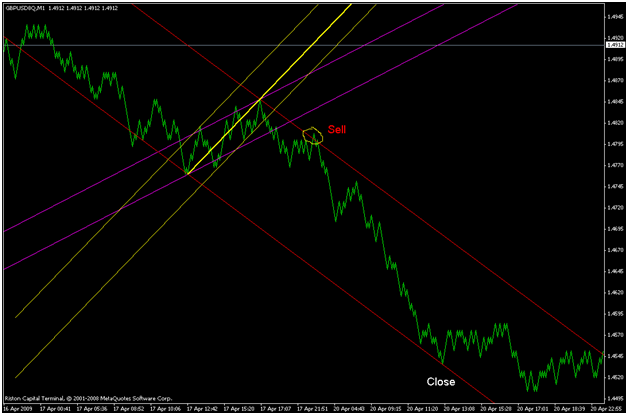
In the second chart, the yellow current channel is built on a pullback.
The quality of the calculated alpha channel was not affected at all, although the basic rollback is quite short. But quanta, they are quanta in Africa.
Here, the price breaks the yellow support line, we wait, breaks the violet, we wait, returns, beats on the purple support line, which has already turned into a resistance line, bounces down and here you can sell. This is an aggressive strategy.
In the conservative version, we are still waiting for it to bounce off the red line of resistance and calmly open a short position.
By touching the red support line, we take profit.
If the fall continues, then we will re-open on the rebound from the red line of resistance.
Such is the simplest scheme of work on quantum channels.
COMMUNICATION OF QUANTUM CHANNELS WITH CLASSICAL FIGURES OF TA
All the classics of figures are just a set of special cases of price transition from one channel to another.
The picture shows the transition in the form of a double bottom reversal pattern:

Let's do a thought experiment.
Imagine that the walls of the channels are translucent mirrors, and the green price path is the beam of the laser pointer that moves in these mirror channels.
Slowly rotating the pointer, i.e. changing the angle of entry of the laser beam into the black channel, we will see all the previously described and even more indescribable reversal patterns that will form in the zone of intersection of the channels.
So, I believe that the thinking of traders should be transferred to a higher level of abstraction, when we operate not with a random and far from complete set of graphic figures, but with the intersection of two channels.
Moreover, Duka has already proved that the exchange price moves through channels, only through channels, and nothing else.
It’s just that she periodically changes one channel to another. And the possible options for choosing the next channel are described by formulas and are calculated at one point when the channel is just beginning to form.
This is true forecasting.
For anyone wanting to read ahead of time https://www.mql5.com/ru/forum/325214
SUMMARY BY CHANNELS
So, to summarize the subtotals for the channels.
First, the quantum exchange price moves through quantum channels, only through channels and nothing else. Moreover, the channels of movement periodically change. This is strictly proven. This is the law. This creates a powerful theoretical foundation for channel trading methods.
Secondly, the quantum price fits much more accurately into the quantum channel, demonstrates false breakdowns much less often, etc. than the regular price driving in the regular channel. Because quantum time flows non-linearly relative to astronomical time, and the quantum graph due to This plasticity in time fits much more accurately into the quantum channel, which is the natural habitat of the quantum price.
Thirdly, it is possible to choose from four channels for further movement when the price leaves the current channel. And these channels are calculated according to Dook’s formulas in advance, without waiting when they form three reference points. And this is real forecasting.
- Free trading apps
- Over 8,000 signals for copying
- Economic news for exploring financial markets
You agree to website policy and terms of use
Gentlemen of analytics and traders!
A study of the forum revealed that Duke's quantum analysis little attention is paid undeservedly.
The author of this method, Andrei Duka, a former professor at St. Petersburg University, has proved the effectiveness of his theory with his personal biography. Ducascopy-based risk management enabled him to create a successful brokerage office in Switzerland, which quickly grew to the Dukascopy Group, which includes a bank and much more. And all this, mind you, under Swiss law.
Dook's fundamental article, "The General Theory of Evolution or Ducascopy," was published in 2000 and led to the birth of a new direction in technical analysis.
The main ideas are as follows:
But enough abstract theories, what useful can we finally get from all this? Why is analysis in Dook's quantum space better than stock price analysis in the real world?
Well, firstly, in the Duka quantum space, where the quantum is a photon of light, and the price trend is a quasiparticle, the speeds are constant and there is a fan of speeds, which greatly reduces uncertainty, since there can be sharp jumps in quotes in the real space of the exchange price, so and a long monotonous side with minimal price changes .
Secondly, it follows from the quantum nature of the Dook space that price moves along channels and only through channels. Dook's theory created a theoretical foundation for all channel trading strategies. And the Heisenberg uncertainty principle allows us to easily calculate the width of the current channel of movement.
Thirdly, the channel of the future movement of the exchange price is calculated when it is just starting to form. This is forecasting. And according to the classics, a channel can be drawn at least in three points. When it is too late to enter the market.
Well, enough for the seed. Next, we will discuss the theory as it is necessary for practice.