Renko doubt
Number 2 is correct this is why no 2 opposite color bars are ever next to each other
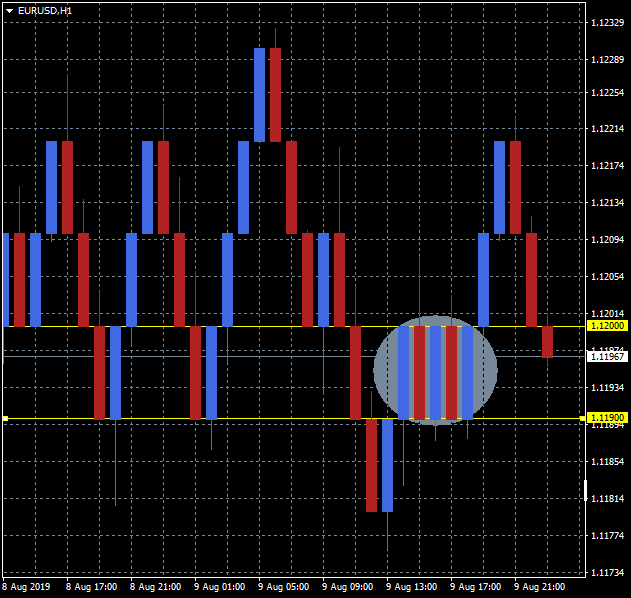
in case 1 I use median value of the brick so di distance of every brick ( up to up or up to down) is always the brick value so no opposite colors bar are next each other. So the doubt is still in my head.
in case 1 I use median value of the brick so di distance of every brick ( up to up or up to down) is always the brick value so no opposite colors bar are next each other. So the doubt is still in my head.
Number 2 is correct this is why no 2 opposite color bars are ever next to each other
That does not need to be like that at all
In fact you are losing information about ranging market in renko charts that way
That does not need to be like that at all
In fact you are losing information about ranging market in renko charts that way
What do you suggest? Drawing opposite direction bar at same ratio as drawing a consecutive direction bar? Could you tell me more what you mean by losing information about the trend? Do most renko charts 'lie' by using close data only? Any interesting EA's you know of operating with Renko? Thanks
I my opninion, Renk is very good for filtering market noise but using closing prices is a limit.
The user can
decide if using closing price or updating the brick at
every
tick.
I see renko with wick and tail, other without them...
Of course you can also draw wicks.
Suppose your brick size is set at 20 and price moved only 18 then you can draw a 18 wick to illustrate that it almost made it.
It all boils down to personal preference.
That does not need to be like that at all
In fact you are losing information about ranging market in renko charts that way
What do you suggest? Drawing opposite direction bar at same ratio as drawing a consecutive direction bar? Could you tell me more what you mean by losing information about the trend? Do most renko charts 'lie' by using close data only? Any interesting EA's you know of operating with Renko? Thanks
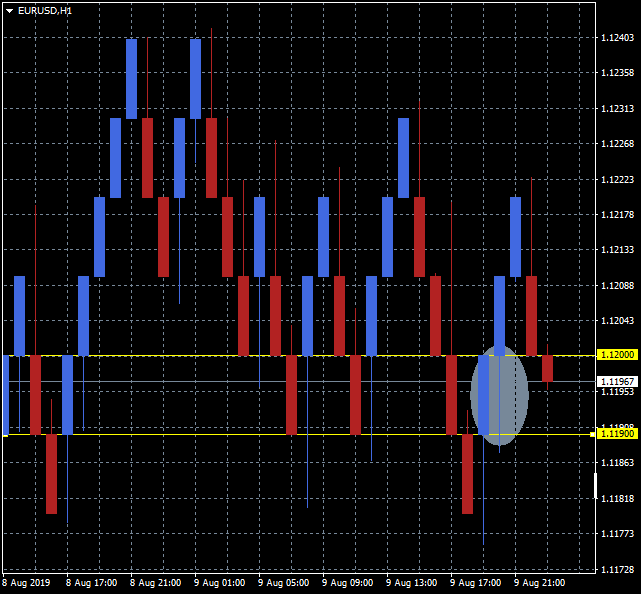
This is a traditional renko brick so different colors are never next to each other since a brick is only drawn when the price has reversed the size of a brick above the high or below the low of the previous brick. You might have an option to see a "wick" for each brick that would how you the range of prices that were in the opposite direction WITHOUT actually going far enough to create a new brick.
There are other types of Renko bars, called median or turbo Renko bricks, that will overlap the bricks by a percent like 33% or 50% if you would like to see a smoother graph. Check out Market if you don't know about these and are interested.
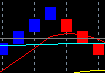
I found a simple and perfect graph:
- Free trading apps
- Over 8,000 signals for copying
- Economic news for exploring financial markets
You agree to website policy and terms of use
Reading articles around I feel confused about Renko bars...
it looks like there are 2 intepretation:
1) every X pips a new bar is created
2) if direction of previous is up, a new bar is created after X pips up otherwise a new bar is created after 2X down...
Where is the truth?