Integration of Python with MT4/MT5
There is one thread in rus part of the forum: Making a Python trading system for Metatrader
It is one of the last post on the thread -
Forum on trading, automated trading systems and testing trading strategies
Making a trading system in Python for MT.
Yuriy Asaulenko , 2019.02.09 19:01
Finally mastered the layout of graphics in Python. Oh, it is hard to swim in hydrochloric acid to master matplotlib package.
Here is the result on the chart:
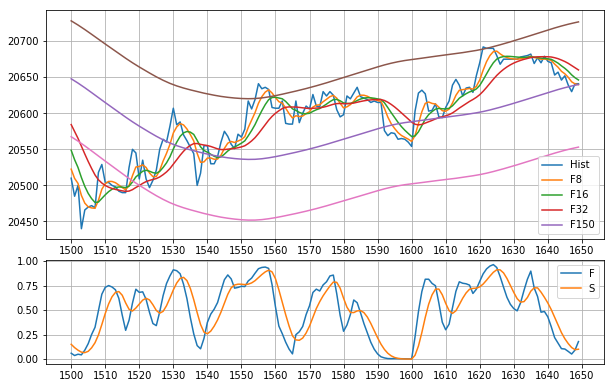
I like.)
And here is the code:
import MyPack.Filters as flt
import TSClasses as tsc
import matplotlib.pyplot as plt
#import numpy as np
# from scipy.stats import randint

#rv=randint.rvs( 0 , 10 ,size= 10 )

# чтение данных из БД
DB= 'csvdb1.db'
Ticker= 'SPFB.SBRF-9.18'
c=flt.cCandle()

SD=tsc.StockData(DB,
                 Ticker)
rdb=SD.rdb
F8=SD.F8
F16=SD.F16
F32=SD.F32
F150=SD.F150
rd=SD.rdb
Dev=SD.Dev
Stoch=SD.Stoch

# определение диапазона значений по оси х
Ib= 1500
Ie=Ib+ 150

# подготовка данных для графиков
I=[i for i in range(Ib,Ie)]
Hist=[rdb.history[i][c.c] for i in I]
f8=[F8[i] for i in I]
f16=[F16[i] for i in I]
f32=[F32[i] for i in I]
f150=[F150[i] for i in I]
Devp=[F150[i]+Dev[i] for i in I]
Devm=[F150[i]-Dev[i] for i in I]
Kpb=[Stoch[ 0 ][i] for i in I]
Dpb=[Stoch[ 1 ][i] for i in I]

# построение графиков
#fig, axs = plt.subplots( 2 , 1 ,figsize=( 10.0 , 5 ))

fig = plt.figure(figsize=( 10 , 6.5 ))
axs1 = plt.subplot2grid(( 3 , 1 ), ( 0 , 0 ),rowspan= 2 ,fig=fig)
axs2 = plt.subplot2grid(( 3 , 1 ), ( 2 , 0 ), rowspan= 1 ,fig=fig)

axs1.plot(I,Hist, label= 'Hist' )
axs1.plot(I,f8,label= 'F8' )
axs1.plot(I,f16,label= 'F16' )
axs1.plot(I,f32,label= 'F32' )
axs1.plot(I,f150,label= 'F150' )
axs1.plot(I,Devp)
axs1.plot(I,Devm)
axs1.legend()
axs1.set_xticks(range(Ib,Ie+ 10 , 10 ))
axs1.grid(True, which= 'both' )

axs2.plot(I,Kpb, label= 'F' )
axs2.plot(I,Dpb, label= 'S' )
axs2.set_xticks(range(Ib,Ie+ 10 , 10 ))
axs2.legend()
axs2.grid(True)

plt.show()
The code is given in its entirety, but I don’t provide any data, it is impossible - it will be necessary by myself. Need to use only # graphing. Other, just for understanding - what, where and from where.
I do not write comments as usual, but it will be easier for you to deal with ready copies.
- Free trading apps
- Over 8,000 signals for copying
- Economic news for exploring financial markets
You agree to website policy and terms of use
Please help me regarding the integration of Python with Mt4/Mt5 ?
Please provide info regarding the codes to link Python with Metatrader.....