Candlestick Charting - Vol 13 - Bearish Engulfing Pattern
Forum on trading, automated trading systems and testing trading strategies
Libraries: MQL5 Wizard - Candlestick Patterns Class
Sergey Golubev, 2013.09.11 16:21
Bearish Engulfing Pattern
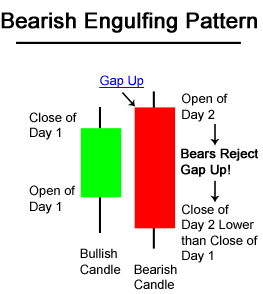
The Bearish Engulfing Candlestick Pattern is a bearish reversal pattern, usually
occuring at the top of an uptrend. The pattern consists of two Candlesticks:
- Smaller Bullish Candle (Day 1)
- Larger Bearish Candle (Day 2)

Generally, the bullish candle real body of Day 1 is contained within the real body of the bearish candle of Day 2.
The market gaps up (bullish sign) on Day 2; but, the bulls do not push very far higher before bears take over and push prices further down, not only filling in the gap down from the morning's open but also pushing prices below the previous day's open.
With the Bullish Engulfing Pattern, there is an incredible change of sentiment from the bullish gap up at the open, to the large bearish real body candle that closed at the lows of the day. Bears have successfully overtaken bulls for the day and possibly for the next few periods.
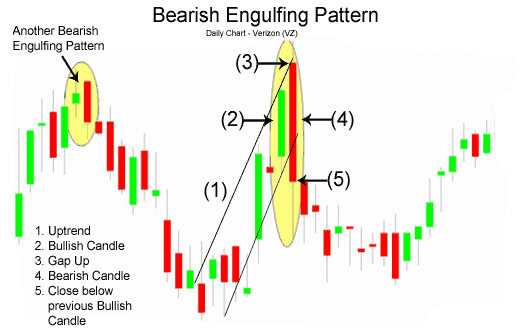
The chart below of Verizon (VZ) stock shows an example two Bearish Engulfing Patterns occuring at the end of uptrends:

Three methodologies for selling using the Bearish Engulfing Pattern are listed below in order of most aggressive to most conservative:
- Sell at the close of Day 2. An even stronger indication to sell is given when there is a substantial increase in volume that accompanies the large move downward in price.
- Sell on the day after the Bearish Engulfing Pattern occurs; by waiting until the next day to sell, a trader is making sure that the bearish reversal pattern is for real and was not just a one day occurance. In the chart above of Verizon, a trader would probably entered on the day after the Bearish Engulfing Pattern because the selling continued.
- Usually trader's wait for other signals, such as a price break below the upward support line, before entering a sell order. However, in the case of Verizon above, the Bearish Engulfing Pattern occured at the same time as the trendline break below support.
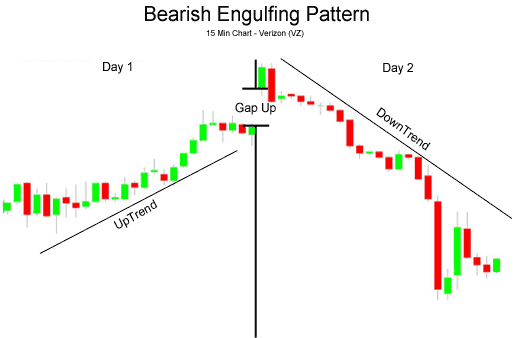
An example of what usually occurs intra-day during a Bearish Engulfing Pattern is presented next.
Intra-day Bearish Engulfing PatternThe following 15-minute chart of Verizon (VZ) is of the 2-day period comprising the Bearish Engulfing Pattern example on the prior page:

- Day 1: As is seen in the chart above, Day 1 was an up day, closing near the day's high (bullish sentiment).
- Day 2: The open was a gap up, a very bullish sign; nevertheless, the bulls ran out of buying pressure and prices fell the rest of the day, closing near the day's lows (bearish sentiment) and lower than Day 1's lows.
Forum on trading, automated trading systems and testing trading strategies
Something Interesting to Read February 2014
Sergey Golubev, 2014.02.02 08:57
High Profit Candlestick Patterns : Stephen Bigalow

High profit trading patterns, revealed by utilizing time-honored
Japanese candlestick signals. A straight-forward approach to
understanding and exploiting market opportunities. Practical
applications to predict stock price movements consistently and
profitably, a winning system in good times or bad! All detailed in:
"High Profit Candlestick Patterns: Turning Investor Sentiment into
Profits" By Stephen W. Bigalow
Don’t play the market, Beat the Market! Stephen W. Bigalow’s first book
"Profitable Candlestick Trading" taught the novice investor how to
quickly identify the best trading opportunities. Now his new book, "High
Profit Candlestick Patterns" takes his teaching to the next level.
Combining the proven results of Japanese Candlestick charting with
effective Western technical analysis, produces even higher profit
wealth-building stock selection techniques. Learn the key to profitable
stock selection with this safer approach to investing and avoid
expensive trading mistakes. Quickly learn the simplest, yet most
intelligent, approach to stock selection. Candlestick signals visually
produce compelling results. Japanese candlestick charting techniques,
integrated with statistically proven Western technical analysis,
produces an even more powerful investment platform. The ability to
recognize trading patterns in their very early stages empowers an
investor with high profit trading strategies.
For the technical investor, the combined analysis provides potent
trading programs. The fundamental investor gains tremendous insights
into the timing of positions. The introduction of cutting-edge computer
generated technical analysis, with the world's most proven trading
technique, becomes a powerful tool for understanding the movements of
the markets. Discover simple techniques that put the probabilities
highly in your favor.
Japanese candlestick signals provide an immense amount of information.
They graphically depict what is occurring in investor sentiment. This
alone provides a huge advantage for the investor. Having the ability to
identify reversals in price trends, utilizing statistically proven and
utilized signals, allows an investor to develop high profit trading
strategies. The psychological elements not only reveal trend reversals,
but they provide the insights for understanding why that reversal is
occurring. This becomes a very powerful investment tool.
The graphic illustrations in this book are simple common sense
revelations. Utilizing candlestick signals in conjunction with Western
technical patterns produces two strong investment elements. First, it
allows for the recognition of the optimal times for entering a trade.
Second, the candlestick signals revealed immediately when the trend
pattern is not performing correctly, allowing for quick exits.
You will receive a whole new perspective for profitably investing in the
markets. You do not have to learn formulas nor develop investing
talents. The combination of candlestick signals with easy-to-identify
trading patterns will vastly expand your investment confidence. The
self-mastery of profitable investing is greatly simplified with quick
visual evaluations.
Bearish Engulfing Signal and Shooting Star
The Bearish Engulfing Candlestick Pattern is a bearish reversal pattern, normally happening at the top of an uptrend. It consists of a large block at the end of a trend. The shooting star is similar to the bearish engulfing signal. It consists of a bearish reversal candlestick pattern that normally takes place at the top of an uptrend. The shooting star chart pattern is created when the open, low, and close are roughly the same price.
- Bullish and Bearish Engulfing - expert for MetaTrader 5
- Engulfing with RSI - expert for MetaTrader 4
- VR Engulfing Pattern - indicator for MetaTrader 4
- Free trading apps
- Over 8,000 signals for copying
- Economic news for exploring financial markets
You agree to website policy and terms of use
Stop Loss: Exit for a 6 pips loss or if the trade lasts more than 1 minute.
In the picture below an example of setup for trade with the candlestick pattern Engulfing Bearish