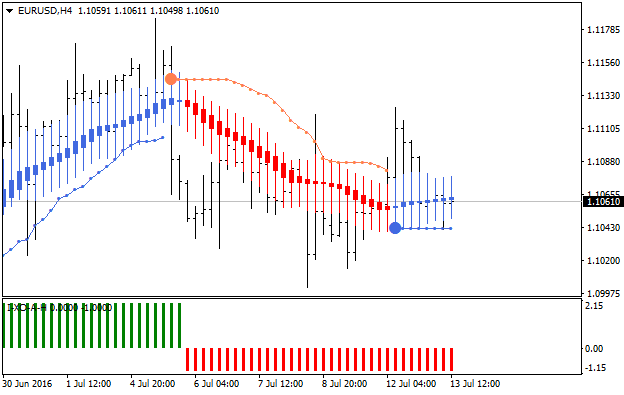
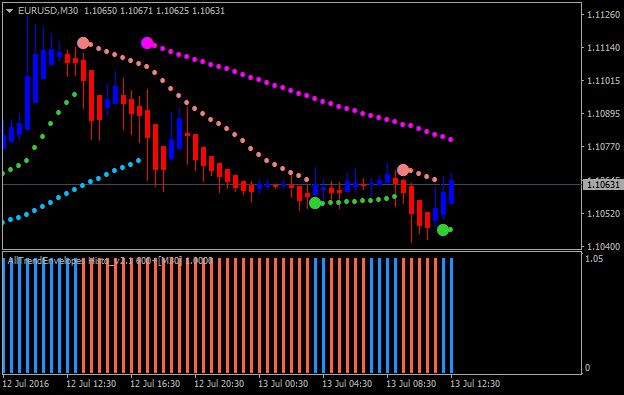
hi, i want to create an ea based on heiken ashi
i want to enter long if candle 2 is red and candle 1 is green ,someone can help me?thx
You can try and search the code base using the search term 'Heiken Ashi' and see which one meets your requirements.
However you may also want to try the Freelance section of this website https://www.mql5.com/en/job/new if you are not experienced in creating Expert Advisors.
Kind Regards,
Ricardo

- www.mql5.com
Heiken Ashi
Heiken Ashi indicators
- Heikin Ashi (better formula) thread
- Heiken-ashi Zero-lag Tema thread
- Heiken_Ashi_Smoothed indicator with/without alert fixed by mladen - the thread
- Many Jurik indicators with Heiken_Ashi - the thread
- NONLAG Heiken Ashi - the thread
- Heiken Ashi Zma indicator with alert - the thread
- Heiken_Ashi_Ma_T3 indicator for Mr.Nims, Renko Ashi Scalping System thread
Heiken Ashi documentation
- Heiken Ashi documentation and FAQ - the thread
Trading systems based in Heiken_Ashi
- HAMA PAD system thread
- ISAKAS ashi by Kuskus_Osentogg thread
- Collaboration Dolly + Isakas + Nina System thread
- XO_Method REVISED thread
- Heikien-Ashi Smoothed system thread
- heiken ashi strategy: some modification of well-known system - the thread
- MMA-Pivot-Fibo system thread
Heiken Ashi EAs
The Article
- An Example of a Trading System Based on a Heiken-Ashi Indicator - MetaTrader 5 article
Forum on trading, automated trading systems and testing trading strategies
Sergey Golubev, 2016.07.13 11:36
How To Trade - Heiken Ashi indicator and How Does It Work (adapted from the article)
Heikin-Ashi chart looks like the candlestick chart, but the method of calculation and plotting of the candles on the Heikin-Ashi chart is different from the candlestick chart. In candlestick charts, each candlestick shows four different prices: Open, Close, High and Low price.

But Heikin-Ashi candles are different and each candle is calculated and plotted using some information from the previous candle:
1- Open price: the open price in a Heikin-Ashi candle is the average of the open and close of the previous candle.
2- Close price: the close price in a Heikin-Ashi candle is the average of open, close, high and low prices.
3- High price: the high price in a Heikin-Ashi candle is chosen from one
of the high, open and close price of which has the highest value.
4- Low price: the low price in a Heikin-Ashi candle is chosen from one
of the low, open and close price of which has the lowest value.
So candles of a Heikin-Ashi chart are related to each other because the open price of each candle should be calculated using the previous candle close and open prices, and also the high and low price of each candle is affected by the previous candle. So a Heikin-Ashi chart is slower than a candlestick chart and its signals are delayed.

The Heikin-Ashi chart is delayed and the candlestick chart is much
faster and helps us to make more profit. Why should we use a Heikin-Ashi
chart then? As it was already explained, because of the delay that the
Heikin-Ashi chart has, it has less number of false signals and prevent
us from trading against the market. On the other hand, Heikin-Ashi
candles are easier to read because unlike the candlesticks they don’t
have too many different patterns.
Free to Download for Metatrader 5
There are many Heiken Ashi indicators (and EA) on MT5 CodeBase, for example :
Trading signals module based on Heiken_Ashi_Smoothed indicator
Heiken_Ashi_Smoothed_HTF_Signal
========
An Example of a Trading System Based on a Heiken-Ashi Indicator
Heiken Ashi based EA- Free trading apps
- Over 8,000 signals for copying
- Economic news for exploring financial markets
You agree to website policy and terms of use
hi, i want to create an ea based on heiken ashi
i want to enter long if candle 2 is red and candle 1 is green ,someone can help me?thx