Hi everyone!
Free of what indicator or EA I am trying to develop, isn't there an easy straight-forward way to draw a simple vertical line on indicator window (in i-th bar)?? Does it necessarily require to create and call a function??
Assuming you are using MQL4. Just call this function with the date and time when you want the line to be placed. For instance: VerticcalLine( TimeCurrent() );
void VerticalLine( datetime _CoordX, string _Text = NULL ) {

        long _chart_id = ChartID();

        string _ObjName = "LinVert_" + (string)_CoordX;

        if ( !ObjectCreate( _chart_id, _ObjName, OBJ_VLINE, inpSubwindow, _CoordX, 0 ) )
        {
                if ( MostrarMsgEstado ) Print(__FUNCTION__, ": no se pudo crear la línea vertical debido a ", ErrorDescription( GetLastError()) );
                return(NULL);
        }

        //--- set line color
        ObjectSetInteger( _chart_id,_ObjName,OBJPROP_COLOR, clrRed );

        //--- set line display style
        // Select: STYLE_SOLID, STYLE_DASH, STYLE_DOT, STYLE_DASHDOT, STYLE_DASHDOTDOT
        ObjectSetInteger( _chart_id,_ObjName,OBJPROP_STYLE, STYLE_DASH );

        //--- set line width
        ObjectSetInteger( _chart_id,_ObjName,OBJPROP_WIDTH, 1 );

        //--- display in the foreground (false) or background (true)
        ObjectSetInteger( _chart_id,_ObjName,OBJPROP_BACK, TRUE );

        //--- set the tooltip text
        ObjectSetString( _chart_id,_ObjName, OBJPROP_TOOLTIP, _Text );

        //--- enable (true) or disable (false) the mode of moving the line by mouse
        //--- when creating a graphical object using ObjectCreate function, the object cannot be
        //--- highlighted and moved by default. Inside this method, selection parameter
        //--- is true by default making it possible to highlight and move the object
        ObjectSetInteger( _chart_id,_ObjName,OBJPROP_SELECTABLE, TRUE );
        ObjectSetInteger( _chart_id,_ObjName,OBJPROP_SELECTED,   FALSE );

        //--- hide (true) or display (false) graphical object name in the object list
        ObjectSetInteger( _chart_id,_ObjName,OBJPROP_HIDDEN, FALSE);

        //--- set the priority for receiving the event of a mouse click in the chart, default=0
        ObjectSetInteger( _chart_id,_ObjName,OBJPROP_ZORDER, 0 );

        //--- successful execution
        return ();
}
Assuming you are using MQL4. Just call this function with the date and time when you want the line to be placed. For instance: VerticcalLine( TimeCurrent() );
Thank you Fernando for your prompt reply.
So it does require to create and call a function. I'd hoped it would be concluded in one or two line of code. (grin)
Thanks again.
Hi again!
My code is attached. I am trying to draw a vertical line whenever LineBuffer_P1 and LineBuffer_P2 offset more than 10% (or any lower percentage). Fernando Morales's function didn't work (read I couldn't figure it out). Therefore I used mql4 reference library example to get it going. Still nothing. Can anyone tell me where I am wrong???
Hi everyone!
Free of what indicator or EA I am trying to develop, isn't there an easy straight-forward way to draw a simple vertical line on indicator window (in i-th bar)?? Does it necessarily require to create and call a function??
I recommend using the iCanvas class based on the CCanvas class.
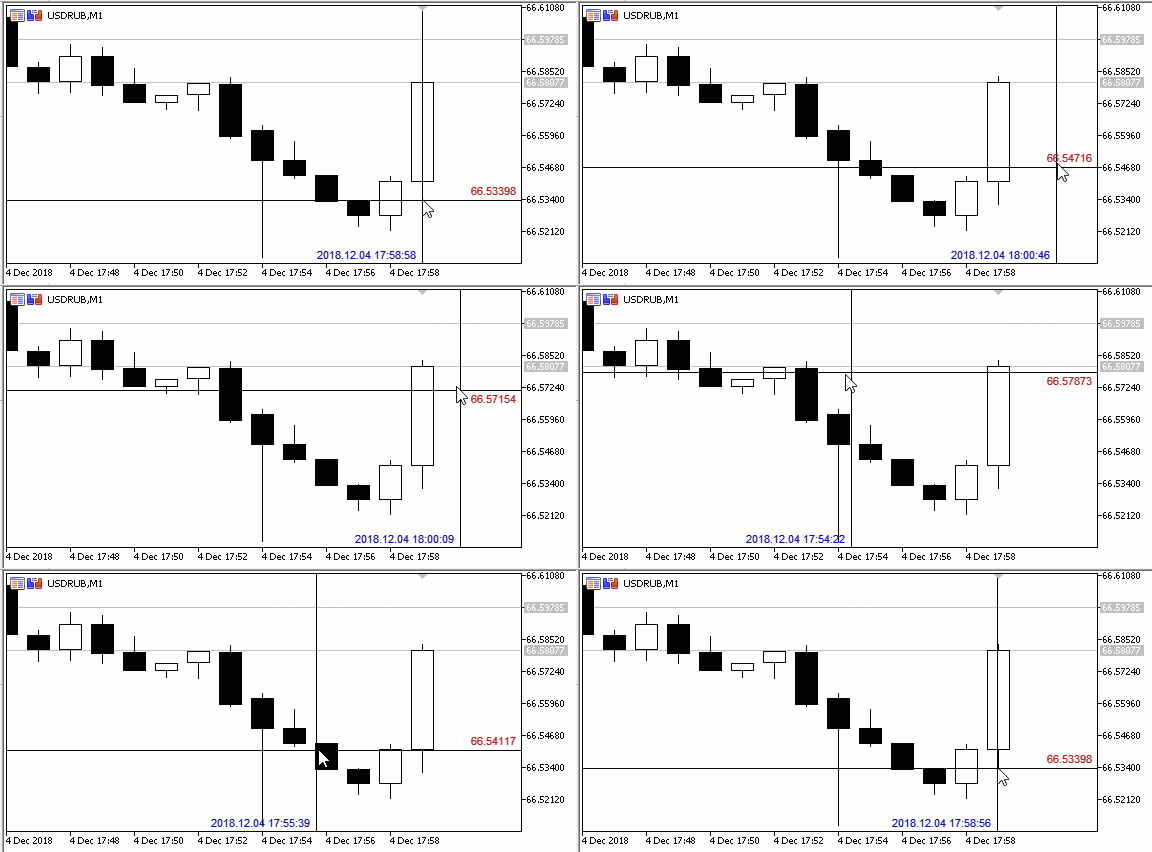
Here is an example of a simple indicator that displays crosshairs and price and time information on the mouse pointer.

#property indicator_chart_window
#include <Canvas\iCanvas.mqh> //https://www.mql5.com/en/code/23840

int OnInit()
  {
   return(INIT_SUCCEEDED);
  }

int OnCalculate(const int rates_total, const int prev_calculated, const int begin, const double &price[])
  {
   return(rates_total);
  }

void OnChartEvent(const int id, const long &lparam, const double &dparam, const string &sparam)
  {
    if (id==CHARTEVENT_MOUSE_MOVE || id ==CHARTEVENT_CHART_CHANGE)
    {
     Canvas.Erase(0);
     static datetime t=iTime(_Symbol,_Period,10);                                 // time of 10th bar
     Canvas.LineVertical(Canvas.X(t),0,W.Height-1,ColorToARGB(clrBlue));   // Draw a vertical line by the time
     Canvas.LineVertical(Canvas.X(20.0),0,W.Height-1,ColorToARGB(clrRed)); // Draw a vertical line by bar number (20.0). The bar number must be type double.
 // Crosshairs drawing
     Canvas.LineHorizontal(0,W.Width-1,W.MouseY,~W.Color);
     Canvas.LineVertical(W.MouseX,0,W.Height-1,~W.Color);                  // Draw a vertical line by the mouse position

 // Display text information about price and time
     int Ym=(W.MouseY>W.Height/2)?(W.MouseY-16):(W.MouseY+2);
     int Xm=(W.MouseX< W.Width/2)?(W.MouseX+4):(W.MouseX-105);
     Canvas.FontSet("Arial",14);
     Canvas.TextOut(W.Width-50,Ym,DoubleToString(W.MousePrice,_Digits),0xFFFF0000);
     Canvas.TextOut(Xm,W.Height-16,TimeToString(W.MouseTime,TIME_DATE|TIME_SECONDS),0xFF0000FF);
     Canvas.Update();
    }
  }
It is much easier and shorter than bothering with objects. It is only important not to forget to do on time erasing (Canvas.Erase(0);) and updating(Canvas.Update();).
- Free trading apps
- Over 8,000 signals for copying
- Economic news for exploring financial markets
You agree to website policy and terms of use
Hi everyone!
Free of what indicator or EA I am trying to develop, isn't there an easy straight-forward way to draw a simple vertical line on indicator window (in i-th bar)?? Does it necessarily require to create and call a function??