Colored DRAW_HISTOGRAM according Bull or Bear Candle - page 2

 
Ernst Van Der Merwe:

Hence the example with price.


Hello,
I will do it without histogram, but with line.

Thank you very much for your help.

 
#include <MovingAverages.mqh>
//+------------------------------------------------------------------+
//| Custom indicator initialization function                         |
//+------------------------------------------------------------------+
int OnInit()
  {
   if(!SymbolSelect("EURUSD",true) ||
      !SymbolSelect("EURGBP",true) ||
      !SymbolSelect("EURJPY",true) ||
      !SymbolSelect("EURCHF",true) ||
      !SymbolSelect("EURNOK",true))
      return(INIT_FAILED);
//--- indicator buffers mapping
   SetIndexBuffer(0,EurXBuffer);
   SetIndexBuffer(1,BullBuffer);
   SetIndexLabel(1,NULL);
   SetIndexBuffer(2,BearBuffer);
   SetIndexLabel(2,NULL);
   SetIndexBuffer(3,ShortSMABuffer);
   SetIndexEmptyValue(3,0.0);   
   SetIndexBuffer(4,LongEMABuffer);
   SetIndexEmptyValue(4,0.0);   
   IndicatorBuffers(6);
   SetIndexBuffer(5,CloseBuffer);
   SetIndexEmptyValue(0,0.0);   
//---
   return(INIT_SUCCEEDED);
  }
//+------------------------------------------------------------------+
//| Custom indicator iteration function                              |
//+------------------------------------------------------------------+
int OnCalculate(const int rates_total,
                const int prev_calculated,
                const datetime &time[],
                const double &open[],
                const double &high[],
                const double &low[],
                const double &close[],
                const long &tick_volume[],
                const long &volume[],
                const int &spread[])
  {
//---
   int begin=rates_total-prev_calculated;
   
   if(!prev_calculated)
     {
      begin=MathMin(iBars("EURUSD",_Period)-1,
            MathMin(iBars("EURGBP",_Period)-1,
            MathMin(iBars("EURJPY",_Period)-1,
            MathMin(iBars("EURCHF",_Period)-1,
            MathMin(iBars("EURNOK",_Period)-1,1000)))));
     }             
//---
   for(int i=begin; i>=0 && !_StopFlag; i--) 
      CloseBuffer[i]=34.38805726 * MathPow(iClose("EURUSD",_Period,i),0.3155) *
                                   MathPow(iClose("EURGBP",_Period,i),0.3056) * 
                                   MathPow(iClose("EURJPY",_Period,i),0.1891) *
                                   MathPow(iClose("EURCHF",_Period,i),0.1113) * 
                                   MathPow(iClose("EURNOK",_Period,i),0.0785);
//---
   begin=!prev_calculated?begin-2:rates_total-prev_calculated;
//---
   for(int i=begin; i>=0 && !_StopFlag; i--)
     { 
      EurXBuffer[i]=EurXBuffer[i+1]+CloseBuffer[i]-CloseBuffer[i+1];
      if(EurXBuffer[i]>=EurXBuffer[i+1])
        {
         BullBuffer[i]=EurXBuffer[i];
         BearBuffer[i]=0.0;
        }
      else
        {
         BullBuffer[i]=0.0;
         BearBuffer[i]=EurXBuffer[i];
        }
     }
//---
   SimpleMAOnBuffer(rates_total,prev_calculated,0,ShortSMAPeriod,EurXBuffer,ShortSMABuffer);
//---
   ExponentialMAOnBuffer(rates_total,prev_calculated,0,LongEMAPeriod,EurXBuffer,LongEMABuffer);   
//--- return value of prev_calculated for next call
   return(rates_total);
  }
//+------------------------------------------------------------------+
 
Ernst Van Der Merwe:

I have give up the candle ihstogram idea for better one (to me).
Nb : anyway, thank you very much for your help.

 
Here is my new idea :
Always from this work https://www.mql5.com/go?link=https://www.mql5.com/ru/code/9780
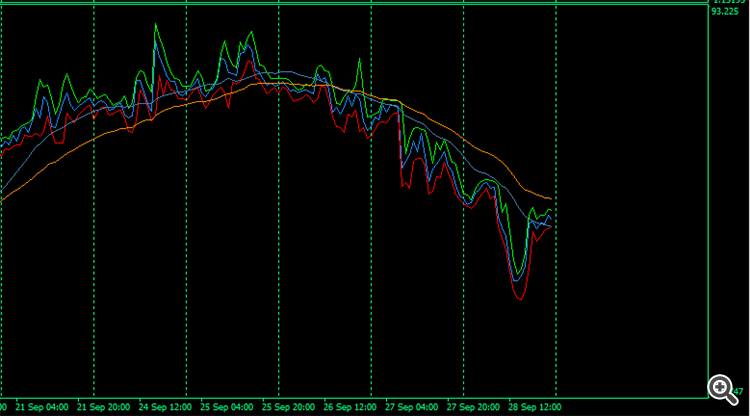
I have added the high and low lines like this.

// --- original calculation (with high and low added by TLR)
          for(int i=limit; i>=0; i--)
            {
              ExtMapBuffer1[i]=34.38805726*MathPow(iClose("EURUSD",0,i),0.3155) *
                              MathPow(iClose("EURGBP",0,i),0.3056)* MathPow(iClose("EURJPY",0,i),0.1891) *
                              MathPow(iClose("EURCHF",0,i),0.1113)* MathPow(iHigh("EURAUD",0,i),0.0785);
                              
              ExtMapBuffer2[i]=34.38805726*MathPow(iHigh("EURUSD",0,i),0.3155) *
                              MathPow(iHigh("EURGBP",0,i),0.3056)* MathPow(iHigh("EURJPY",0,i),0.1891) *
                              MathPow(iHigh("EURCHF",0,i),0.1113)* MathPow(iHigh("EURAUD",0,i),0.0785);
                              
              ExtMapBuffer3[i]=34.38805726*MathPow(iLow("EURUSD",0,i),0.3155) *
                              MathPow(iLow("EURGBP",0,i),0.3056)* MathPow(iLow("EURJPY",0,i),0.1891) *
                              MathPow(iLow("EURCHF",0,i),0.1113)* MathPow(iLow("EURAUD",0,i),0.0785);
            }

And I obtain this result in the subwindow :


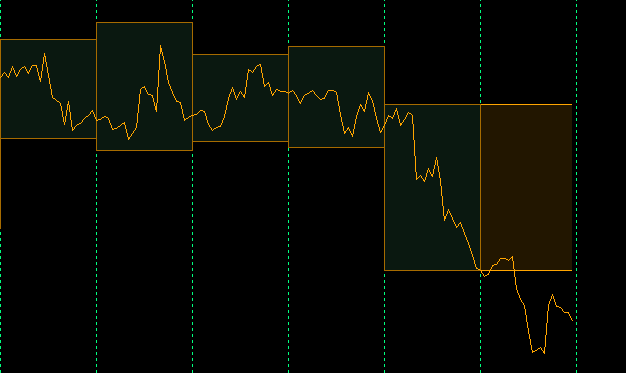
And now, the idea is to get the highs and lows of each day.
Like this code (but not for the price chart, but from and for the subwindow's values) :

// This code is from one of my personnal work to draw range-rectangle's days ;
// And i want to do the same thing with the index subwindow indicator.

//+-------------------------------------------------------------------+
//| draw Days                                                         |                                                                                                                |
//+-------------------------------------------------------------------+
      datetime Prev_Day_Start=iTime(Symbol(),PERIOD_D1,1);
      datetime This_Day_Start=iTime(Symbol(),PERIOD_D1,0);
        
      double Days_Prev_High= iHigh(NULL,PERIOD_D1,1);
      double Days_Prev_Low = iLow(NULL,PERIOD_D1,1);
        
      for(int id=0;id<Days_To_Process;id++)
        {
            tname=TimeToString(iTime(NULL,PERIOD_D1,id+1));
            t_Start=iTime(NULL,PERIOD_D1,id+1);
            t_End=iTime(NULL,PERIOD_D1,id+0);
            high=iHigh(NULL,PERIOD_D1,id+1);
            low=iLow(NULL,PERIOD_D1,id+1);
            open=iOpen(NULL,PERIOD_D1,id+1);
            close=iClose(NULL,PERIOD_D1,id+1);
        
            TLR_OHLC_Candle_Draw_Boxes("TLR_OHLC_Lines_Day_High_Low"+tname,
                                        t_Start,high,t_End,low,
                                        Levels_Day_Dark_clr,
                                        0,false,false,true,
        
                                        "TLR_OHLC_Lines_Day_Open_Close"+tname,
                                        t_Start,0,
                                        t_End,0,
                                        TLR_Candle_clr,
                                        0,
                                        true,
                                        false,
                                        true,
    
                                       "TLR_OHLC_Lines_Day_Bg"+tname,
                                        Levels_Day_Bg_clr);
            } 

To have this result (in subwindow)


At this point, my skills are limited, so I really need deep help with good lines of code very please.

Kind regards.

EURX : Euro Currency Index
  • www.mql5.com
Данный индикатор вычисляет и показывает индекс евро и скользящую и экспоненциальную средние. Для того, чтобы индикатор работал, нужно чтобы брокер предоставлял котировки по парам EURUSD, EURGBP, EURJPY, EURCHF, EURSEK. Код для индикатора взят из http://codebase.mql4.com/ru/code/9397 . Формулы для расчета взяты из...
 
// Here are my questions illustrated in code lines

tname=TimeToString(iTime(NULL,PERIOD_D1,id+1)); // we keep it as it is
t_Start=iTime(NULL,PERIOD_D1,id+1);             // same...
t_End=iTime(NULL,PERIOD_D1,id+0);               // same...
high=iHigh(NULL,PERIOD_D1,id+1);                // How to get the "iHigh" of the indicator in the subwindow ?
low=iLow(NULL,PERIOD_D1,id+1);                  // How to get the "iLow" ... ?
open=iOpen(NULL,PERIOD_D1,id+1);                // How to get the "iOpen" ... ?
close=iClose(NULL,PERIOD_D1,id+1);              // How to get the "iClose" ... ?

// Can I do something like this :
high=ExtMapBuffer2(NULL,PERIOD_D1,id+1); // ?
 
Thierry Ramaniraka:

There is really no way to get the highs and lows for each day on the indicator in the subwindow (like we can do it with the cross price ) ?

 
As i have no response, i think maybe i have gone too far away from the initial title of this thread.
So i will open another one with the focus of my new and last point.

Regards.
 
Thierry Ramaniraka:
As i have no response, i think maybe i have gone too far away from the initial title of this thread.
So i will open another one with the focus of my new and last point.

Regards.

Here it is : https://www.mql5.com/en/forum/282065#comment_8908614

Each day High and Low Values of Index indicator.
  • 2018.10.04
  • www.mql5.com
Hello, I am working on an index indicator based from this one : https://www.mql5...
Reason: