Need help to filter signals
No indicator(s) can predict the future. They aren't "bad" signals, just those where the market didn't fall through. They aren't "good" signals, just those where the market did continue. Welcome to trading.
It may be ppossible ... but you are having too many indicators in your system.
I mean: the person should know your system and used it in trading at least for demo account just to understand something ...
It may be ppossible ... but you are having too many indicators in your system.
I mean: the person should know your system and used it in trading at least for demo account just to understand something ...
all right.. I understand... I have remove some indicators and leave only the main Indicators on the chart.... I think now is better to understand the stop loss problem..


I think - "good" is related to the trending market condition (bearish, bullish), and "bad" is related to the ranging/choppy/flat market condition.
About the market condition in general - example with one indicator:
Forum on trading, automated trading systems and testing trading strategies
Sergey Golubev, 2013.07.01 21:04
How can we know: correction, or bullish etc (in case of using indicator for example)?
well ... let's take AbsoluteStrength indicator from MT5 CodeBase.
bullish (Bull market) :
bearish (Bear market) :
ranging (choppy market - means: buy and sell on the same time) :
flat (sideways market - means: no buy and no sell) :
correction :
correction in a bear market (Bear Market Rally) :
Forum on trading, automated trading systems and testing trading strategies
How to Start with Metatrader 5
Sergey Golubev, 2016.08.12 17:07
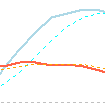
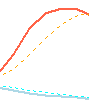
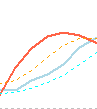
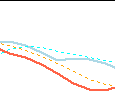
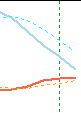
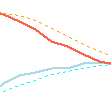
Indicator from the post above? Blue lines (signal line and the dotted line) are the bullish. The combination of those lines are providing the information about the primary trend (bullish only), and the secondary trend. Red lines (2 lines) are for bearish.
- If blue signal line is below blue dotted line = no bullish.
- If blue signal line is below blue dotted line, and red signal line is below red dotted line = flat (no bullish and no bearish).
- If 2 blue lines are above 2 red lines, and blue signal line is above blue dotted line = bullish. Opposite for bearish.
- If blue signal line is above blue dotted line, and red signal line is above red dotted line = ranging (bullish trend and bearish trend on the same time).
- If red lines are below the blue lines and we see the bearish trend on red lines = correction (secondary correction within the primary bullish trend). Opposite for the secondary rally within the primary bearish trend.
Forum on trading, automated trading systems and testing trading strategies
How to Start with Metatrader 5
Sergey Golubev, 2016.08.12 19:08
If you are the coder so you can look at this indicator (inside the code) related to the market condition -AbsoluteStrengthMarket - indicator for MetaTrader 5
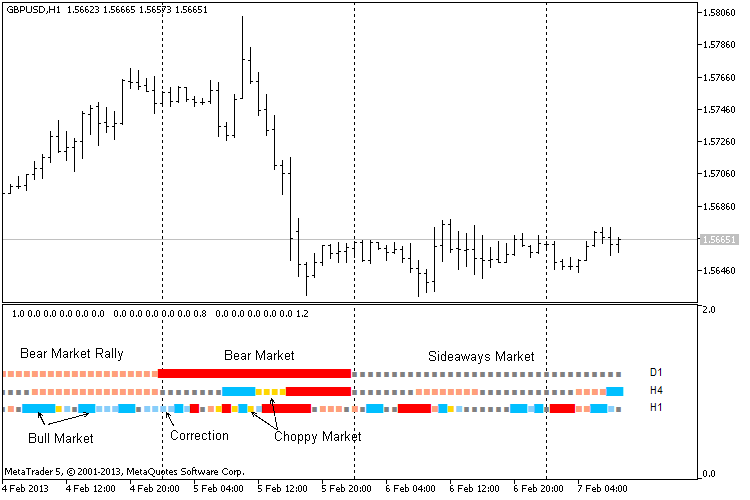
This indicator with a sufficient accuracy allows defining 6 market states, exactly:
- Bull market (Bull Market).
- Bear market (Bear Market).
- Correction (Correction) in a bull market.
- Correction in a bear market (Bear Market Rally).
- Choppy market (Choppy Market).
- Flat market (Sideways Market).
By the way, AbsoluteStrength indicator (on the way I described it on the posts above) is used as a filter for some martingale EAs ... and there is some term (terminology) related to it - Control Martingale, means - trading in predefined market condition only. For example, trading correction/rally only, trading ranging only, trading on the flat only (for martingale scalpers), trading bullish/bearish trend only (trend following EAs), and so on.

- 2015.01.16
- www.mql5.com
I think - "good" is related to the trending market condition (bearish, bullish), and "bad" is related to the ranging/choppy/flat market condition.
About the market condition in general - example with one indicator:
Hi Sergey,
Thank you very very very much... but actually this indicator can show me the ranging or markt correction.. (see attacted image).. the yellow line in the indicator means the market will have short correction and I have to take profit and wait for the next entry chance... But the situation which I show in the last posts are not this case...I try the NrTR from you but the problem is, wenn my Indicator show buy or sell . the NRTR indicator haven't recognize the trend change. So it difficult to combinate these togeter.....

If you are trading based on the market condition so you should accept the losses.
And NRTR is for stop loss value ... not for entrance to the market.
-------------
There are a lot of the indicators (CodeBase and the Market) so you will be able to select something what you need, especially if we all know that all the indicators are same ones
:)
-------------
or use timefilter, for example: trade since 8 am till 5 pm GMT, or on the time when the market for your symbol is on the most trending condition for example.
Hallo,
I have a indicator which provide sometimes good signals but sometimes
bad signals(see attachment 30M and dayly).this is very import for this trading system
because I set the stoploss base on it.
please help if you have some ideas how to filter the bad signals or set stoploss. I can also pay for some additional helpful indis.
Thanks
30 minute time frame :move to higher time frame daily or weekly
1 Trades or 2 good trades a week is enough
check dollar index before placing trades.
Trade in direction of weekly , daily and monthly charts.It will give you less false signals, so all trades on euro would be short.
I gave you some good indicators use them on daily charts.
I give you this pipemaster indicator , use it on hourly charts, if price below all mas only trade shorts.Search on google for "trend retracement strategy" , use trend retracement on daily weekly and monthly charts.If you use this advice give money to charity for children and do some good work.
https://www.mql5.com/en/forum/263417


- 2018.07.06
- www.mql5.com
Hallo all,
thank you for all of you.. I find some problem in my indicators.. repaint.....so I can not use it any more.... but thanks for all nett guys....
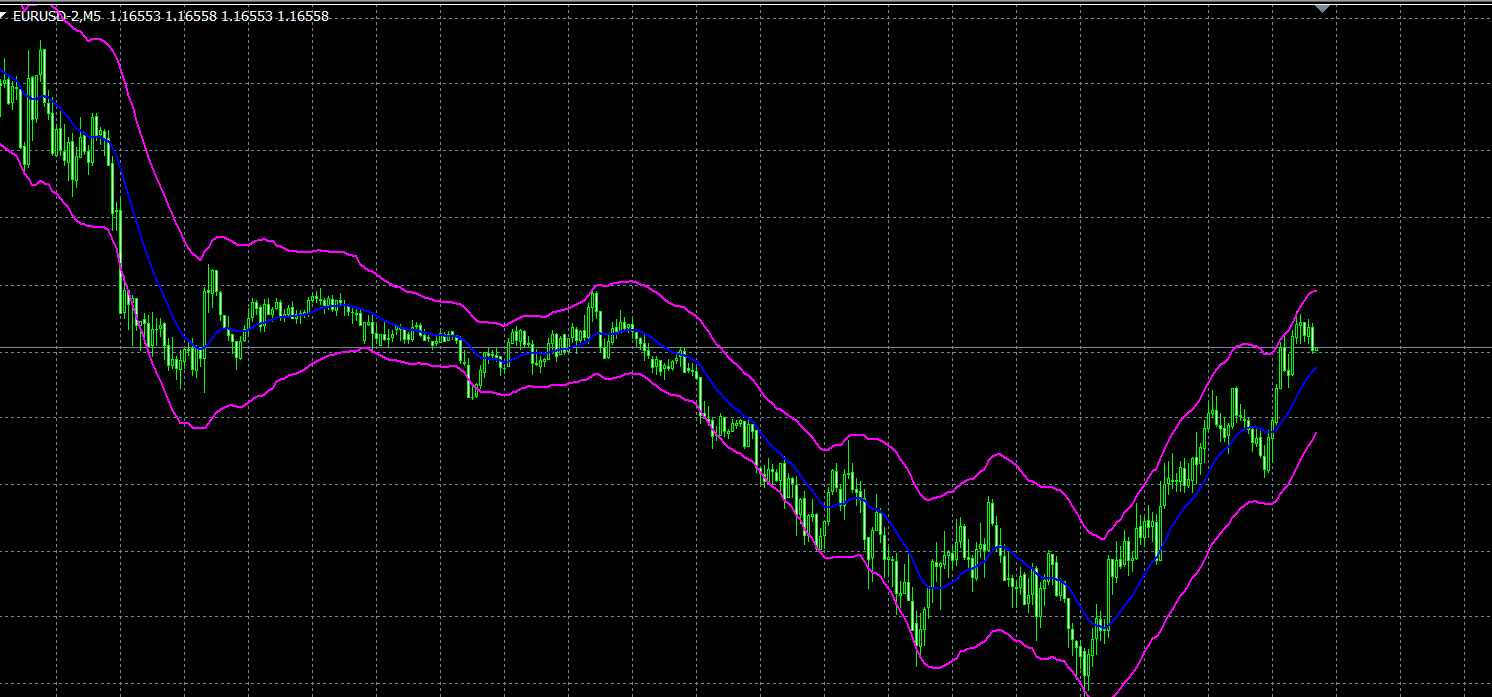
I find a new indicator in the magazine stock and commodities from last month.... it named volatity band. So I share it here with you..
- Free trading apps
- Over 8,000 signals for copying
- Economic news for exploring financial markets
You agree to website policy and terms of use
Hallo,
I have a indicator which provide sometimes good signals but sometimes bad signals(see attachment 30M and dayly).this is very import for this trading system because I set the stoploss base on it.
please help if you have some ideas how to filter the bad signals or set stoploss. I can also pay for some additional helpful indis.
Thanks