Indicators: Parabolic SAR, Parabolic
The built-in Parabolic SAR and Parabolic.mq4 will give different results when overlaid. Everything is a OK on refresh. However, as new bars are formed there are different results. This problem was corrected in Parabolic-Fix.mq4 which gives same results as built-in parabolic.
The built-in Parabolic SAR and Parabolic.mq4 will give different results when overlaid. Everything is a OK on refresh. However, as new bars are formed there are different results. This problem was corrected in Parabolic-Fix.mq4 which gives same results as built-in parabolic.
This indicator is named the Stop And Reverse, SAR, Parabolic. A parabola is one of the three possible conic sections (others being ellipse [the circle is a special case of an ellipse] and hyperbola). Why is this indicator named parabolic?
The next question... What exact parameters in the MQL4 Parabolic SAR indicator code could make it an ellipsoidal shape/surface or a hyperbolic if indeed some set parameters make it parabolic?
The aim of my question(s) have to do with a question of mathematical eccenntricity (from wikipedia on conic sections):
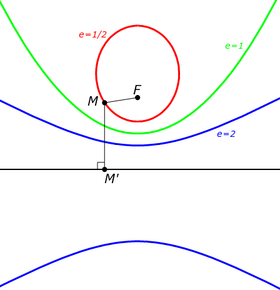 Ellipse (e=1/2), parabola (e=1) and hyperbola (e=2) with fixed focus F and directrix.
The four defining conditions above can be combined into one condition that depends on a fixed point F (the focus), a line L (the directrix) not containing F and a nonnegative real number e (the eccentricity). The corresponding conic section consists of all points whose distance to F equals e times their distance to L. For 0 < e < 1 we obtain an ellipse, for e = 1 a parabola, and for e > 1 a hyperbola.
The objective is for research and development of a 'SAR ellipsoid' and 'SAR Hyberbolic' indicators. It is further for development of a (continuous [24hrs]) 'time series wobble' type of model that is based on the physical phenomenon of a rattleback (rattleback from wikipedia):
A rattleback, also known as an "anagyre", "celt", "Celtic stone", "rebellious celt", "rattlerock", "spin bar", "wobble stone" or "wobblestone" and by the product names "ARK," "Bizzaro Swirls," "RATTLEBACKS," "Space Pet" and "Space Toy," is a semi-ellipsoidal top which will spin on its axis in a preferred direction. But, if spun in the opposite direction, it becomes unstable, "rattles", stops and reverses its spin to the preferred direction.
Behold the mysterious celt, with a property that amuses. One way it will spin, the other way it refuses.
This spin-reversal motion seems, at first sight, to violate the angular-momentum conservation law of physics...
I can see its efficacy on the graph, but the values it returns when you call it in a script differ from the values charted, and those values returned in a script are not always on the same side of the price as the charted values.
So, how would you use this indicator in an expert advisor?
To be more specific, I don't see where in the code the dots are actually "told" to be drawn and "told" what values to be drawn at.
I would like to be able to call it using the iCustom() function and get the price location of the dot at any given bar.
This is the call I used, and like I mentioned in the last post, it does not return the value of the green dot: iCustom(Symbol(),60,"Parabolic 1",.02,.2,0,0);
Ho do I get the value of the green dot?
Is there a way to include a Period?
I am looking at creating 2 Parabolic lines.. Current Period and Period + 2 eg. current Hr1 and 2nd line Period_D1,
Or Giving the option to enter the period of the first line. I can just add the indicator twice with different timeframes.
eg.. Chart is at H4, but I want the line to show Daily or Weekly ?
I hope that makes sense.
Thanks for the code...
I will try to ¿optimize? a bit for my idea... to "clean" a bit the price series BEFORE the calc of the value... maybe with a digital filter...
- Free trading apps
- Over 8,000 signals for copying
- Economic news for exploring financial markets
You agree to website policy and terms of use
Parabolic SAR, Parabolic:
Author: MetaQuotes Software Corp.