Indicators: FX5_NeelyElliotWave
Hallo.
How made trading with this indicator?
Regards.
Hallo.
How made trading with this indicator?
Regards.
Hello fede,
This indicator is an aid tool for applying Neely's method of Elliot wave analysis. You need to read Neely's book: 'Mastering Elliot Wave' in order to get the most benefit from this indicator.
It is also useful to identify some chart patterns such as failure swings, or 1-2-3 patterns.
Gookd luck,
When buy and sell?
The wave is not in real time? While?
Regards.
What do you thing, if such points would be tick's middle for chosen period ?
Regards.
S.D.
It is strange, but Neely said - data points sush as High and Low are not proper ones for Monowave plotting...
What do you thing, if such points would be tick's middle for chosen period ?
Regards.
S.D.
This is a quote from Neely's book, chapter 2: General Concepts, what data should
be used to analyze waves?
"The use of closing prices on monthly, weekly, daily, or hourly basis is the most unreliable way to track development of a market from an Elliot wave standpoint. The closing price of a market has little to do with the action which took place intra-monthly, weekly, daily, or hourly. It will not give you any idea of how high or low the market traded during a particular period, thus making it virtually impossible to apply the wide range of pattern spicific criteria presented in this book ... . "
Regards,
Regards...
But see Fig. 2-5, page 2-8 in this book...
Regards...
I don't see any contradiction in this part of the book. The figure is illustrating
the importance of the High and Low values and how their order should be considerd.
Maybe you are reffering to Fig 2-4a&b on page 2.7 which illustrates the insufficiency
of the close prices in descriping the price movement in a specific period.
In ideal case, in my opinion, data point should be Tick's price average for chosen period... But, if so, additional preparatory work is needed. Would you like to say something on this ?
Best Regards.
Maybe, yet , I try to plot monowaves using (H+L)/2. When so, no any additional indicators are nesessary - simply take SMA with period 1 and price (H+L)/2.
In ideal case, in my opinion, data point should be Tick's price average for chosen period... But, if so, additional preparatory work is needed. Would you like to say something on this ?
Best Regards.
Using midpoints is a good way to identify Elliot waves, and this approach was advertise by Walker Myles. However Neely's stressed on using a uniform standard method for identifying and numbering the waves; this method depends on the idea of monwaves.
If you want to use midpoint then you are following the conventional classical school of Elliot wave analysis. The school founded by Prechter, Frost, and others. On the other hand if you want a more objective method then you have to stick with Neely's rules.
It doesn't matter which school you follow as long you fully understand the basic principles of Elliot wave analysis.
Good Luck,
Ive been testing it for a while, Ive notice some bugs or is it?
1. When I scrolled the chart far back, the indicator plot crazy monowave. Here the screeshot:
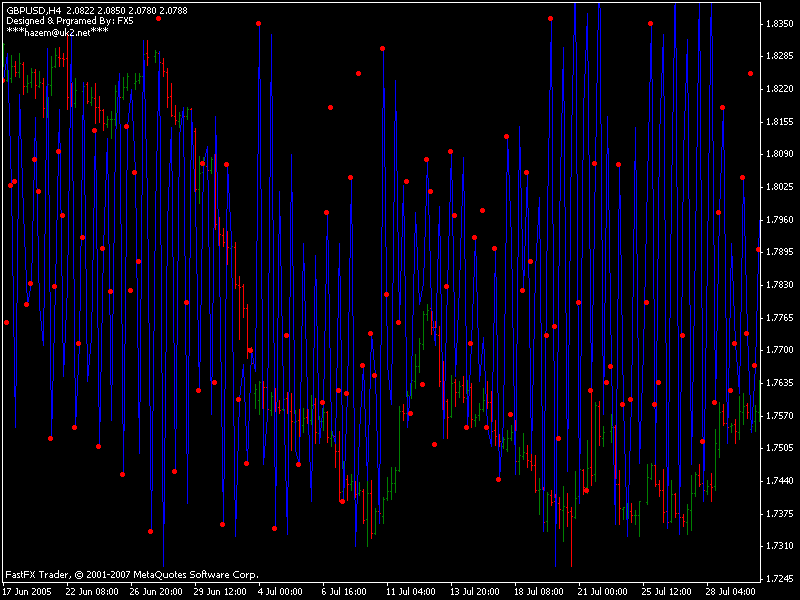
In order to repair back the plot, ive need to reset back the indicator.
2. When Im testing using only daily monowave, The indicator plot the daily monowave on timeframe h1 and h4 diffrently! (havent compare lower timeframe though).
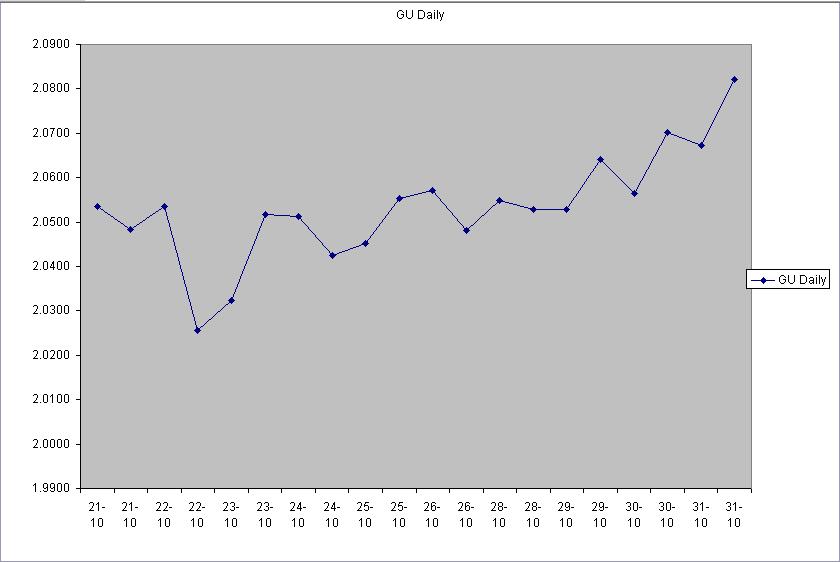
This is the manually drawn chart on excel as instructed by Gleen Neely as comparison: Note that I havent plot the monowave, the dot represent the price of daily high and low, not the monowave.
Here the h1 and h4 chart:
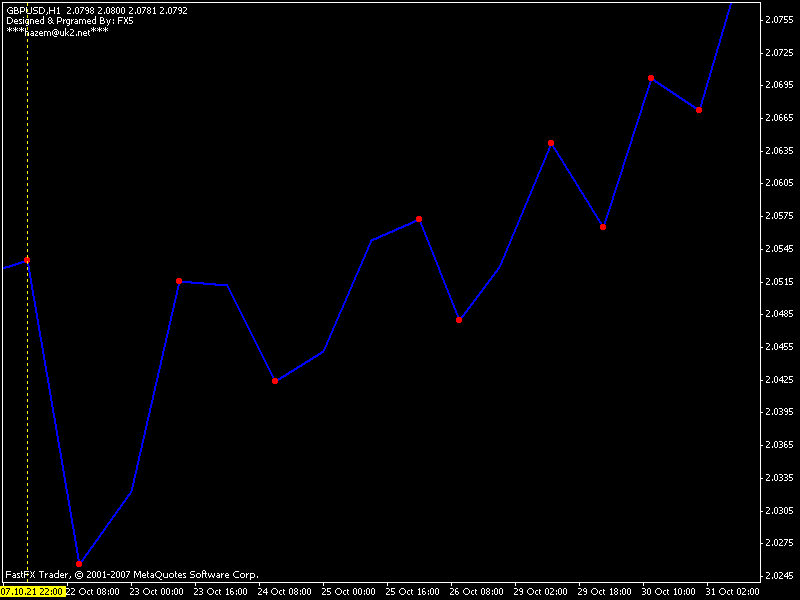
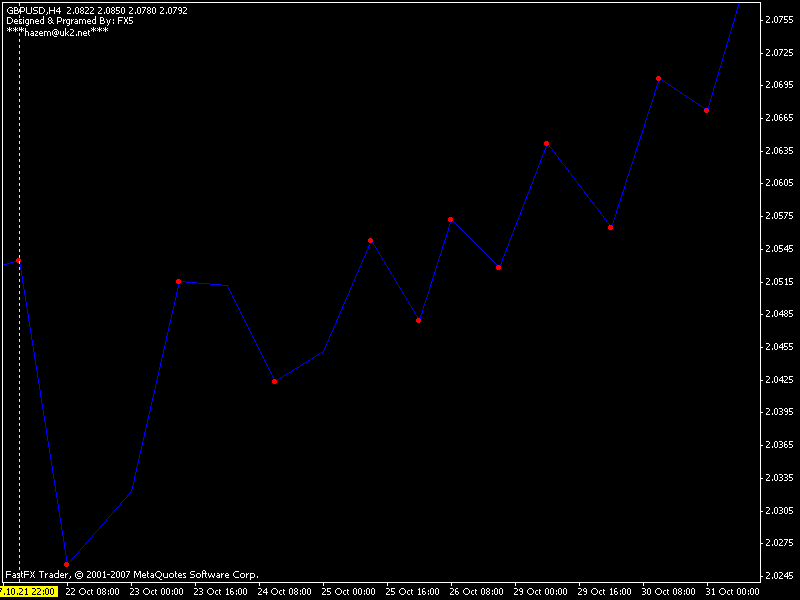
As you can see, h4 have more monowave than h1 chart but h1 chart is almost similar to the manually drawn chart. This is because on manually drawn ive include the sunday candle/bar else on the h1 chart the sunday and monday the indicator combine them.
But I have no idea why h4 chart plot diffrently.
- Free trading apps
- Over 8,000 signals for copying
- Economic news for exploring financial markets
You agree to website policy and terms of use
FX5_NeelyElliotWave:
Author: Hazem