Something Interesting in Financial Video May 2014 - page 4
You are missing trading opportunities:
- Free trading apps
- Over 8,000 signals for copying
- Economic news for exploring financial markets
Registration
Log in
You agree to website policy and terms of use
If you do not have an account, please register
Forum on trading, automated trading systems and testing trading strategies
Press review
newdigital, 2014.05.17 18:05
Silver forecast for the week of May 19, 2014, Technical AnalysisSilver markets tried to rally during the course of the week, but gave up most of the gains by the time we closed on Friday. We see the $20.00 level as massively resistive now, as the market has formed a shooting star. However, we have also formed a couple of hammers in this general vicinity, so the end of the day it’s probably going to be consolidation going forward. If we make a fresh, new low, then at that point time we would be willing to sell, but at this point in time would be very hesitant to do so. As far as buying is concerned, we needed at least a daily close above the $20.00 handle.
Forum on trading, automated trading systems and testing trading strategies
Press review
newdigital, 2014.05.17 18:07
Gold forecast for the week of May 19, 2014, Technical AnalysisGold markets went back and forth during the week, but essentially ended up relatively flat. We sit just below the $1300 level, which is a significant barrier, but it seems to also be the so-called “fair value” of the yellow metal at the moment. With that, we don’t really see much in the way of a trade until we get an impulsive candle, something that we are not seeing at the moment. Because of this, we feel that this is probably going to be more of a short-term traders market at this point.
Forum on trading, automated trading systems and testing trading strategies
Press review
newdigital, 2014.05.17 18:08
USD/JPY forecast for the week of May 19, 2014, Technical AnalysisUSD/JPY pair went back and forth during the course of the week, but found the 101.25 level to be supportive yet again. In fact, that area is being protected by an uptrend line as well, so as a result we feel that this market will more than likely go higher from here, but could very well be contained within the consolidation area that we’ve been stuck in that has an upside limit of 103. Ultimately, we do believe that this market goes higher, but might take a little bit more time to breakout to the 105 level.
Forum on trading, automated trading systems and testing trading strategies
Press review
newdigital, 2014.05.17 18:09
USD/CAD forecast for the week of May 19, 2014, Technical AnalysisThe USD/CAD pair initially tried to rally during the week, but as you can see we ended up falling. We rest right on the 1.0850 handle, an area of significant support. That being the case, we feel that a break down below here will more than likely send this market looking for the 1.07 level first, and then the 1.06 level where we would expect a significant amount of support. Any supportive candle down there, we would be more than willing to start buying. In the meantime though, it does look like this pair is probably going to see more weakness.
Forum on trading, automated trading systems and testing trading strategies
Press review
newdigital, 2014.05.17 18:11
NZD/USD forecast for the week of May 19, 2014, Technical AnalysisThe NZD/USD pair tried to rally during the course of the week, but as you can see pulled back to form a shooting star for the second week in a row. It appears that we are in the middle of consolidation, so it’s difficult to imagine that were going to break down significantly from here, but the fact is that we will more than likely test the 0.85 level in the short term. We believe that a supportive candle in that area is a nice longer-term buying opportunity as the market should head to the 0.90.
Forum on trading, automated trading systems and testing trading strategies
Press review
newdigital, 2014.05.17 18:12
GBP/USD forecast for the week of May 19, 2014, Technical AnalysisThe GBP/USD pair fell during the bulk of the week, but found enough support below to form a hammer. This hammer should send prices back to the upside, but we had a shooting star from the previous week right at the 1.70 level, an obvious resistance area on the longer-term charts. Because of this, we feel that this market will probably go higher, but it may be a bit of a grind from here as the resistance will have to be overcome. However, we get above the 1.70 level, we feel that this market will in fact go much higher, probably to the 1.75 level, if not higher than that. Obviously, that’s a longer-term Outlook, but ultimately we do see that this market has been very well supported and has had a nice uptrend for some time. In fact, the bottom of the hammer from the week touched that uptrend line that we just mentioned.
There should be a bit of a “floor” at the 1.65 handle, which has been massively supportive as well as resistive in the past. In fact, that’s a very thick support zone down to the 1.64 handle at the very least, so the on-demand unit broken to the downside are very slim at this point in time. With that, we think that buying on the dips will be done by short-term traders, and probably will remain so until we get to the 1.75 handle, whenever that ends up being.
If we did manage to break down below the 1.64 handle, we think at that point time the market would be somewhat broken, and would almost have to go down to the 1.60 handle if not lower than that given enough time. However, the interest rate differential continues to favor the British pound, and we see absolutely no reason to think why that’s going to change anytime soon, so ultimately we feel that we are in an uptrend going forward, thereby giving us much more confident on the long side of the equation in this pair.
Forum on trading, automated trading systems and testing trading strategies
Press review
newdigital, 2014.05.17 18:14
EUR/USD forecast for the week of May 19, 2014, Technical AnalysisThe EUR/USD pair fell during most of the week, but did manage to close right at the 1.37 handle, which is significant as it would has been both supportive and resistive recently. On top of that, there is an uptrend of sorts still being held by a line there, and as a result we feel that this market could continue to go higher. We may have just found the summer range – the area between the 1.37 level on the bottom, and the 1.40 level on the top.
Forum on trading, automated trading systems and testing trading strategies
Press review
newdigital, 2014.05.19 19:15
Japanese Yen and Euro Remain the Currencies to Watch in Week Ahead
Forex market conditions favor continuation of Japanese Yen gains versus the downtrodden Euro, while USD trades at support. Which trades are worth watching?
Definitions
Volatility Percentile – The higher the number, the more likely we are to see strong movements in price. This number tells us where current implied volatility levels stand in relation to the past 90 days of trading. We have found that implied volatilities tend to remain very high or very low for extended periods of time. As such, it is helpful to know where the current implied volatility level stands in relation to its medium-term range.
Trend – This indicator measures trend intensity by telling us where price stands in relation to its 90 trading-day range. A very low number tells us that price is currently at or near 90-day lows, while a higher number tells us that we are near the highs. A value at or near 50 percent tells us that we are at the middle of the currency pair’s 90-day range.
Range High – 90-day closing high.
Range Low – 90-day closing low.
Last – Current market price.
Forum on trading, automated trading systems and testing trading strategies
Market Condition Evaluation based on standard indicators in Metatrader 5
newdigital, 2014.05.19 17:51
There is very interesting and unique situation for USDJPY for now : breakdown for D1 and W1 timeframes.
D1 timeframe: Chinkou Span line of Ichimoku indicator is crossing historical price on open bar from above to below, and D1 price is located below Ichimoku cloud/kumo. Nearest support level is 101.31
Possible breakdown.
W1 price: Chinkou Span line is crossing the price on open W1 bar from above to below, but W1 price is located above kumo. Nearest support level is 101.31
Possible correction.
If D1 price will break 101.31 support on close D1 bar so we may see good price movement with the primary bearish to be continuing.
If W1 price will break 101.31 support on close W1 bar so this tendency for downtrend will become long term situation.
If not so we may see the ranging market condition.
How To Use Fibonacci Retracements
Fibonacci Retracements can help traders find significant price points and predict levels of support and resistance. It is based on the Fibonacci sequence of numbers, identified by Leonardo Fibonacci in the thirteenth century. The relationships between those numbers are shown as ratios, and those ratios are used to identify possible reversal levels.
Forum on trading, automated trading systems and testing trading strategies
Indicators: Fibonacci retracement
newdigital, 2013.11.21 12:06
Fibonacci Retracements (based on stockcharts article)
Introduction
Fibonacci Retracements are ratios used to identify potential reversal levels. These ratios are found in the Fibonacci sequence. The most popular Fibonacci Retracements are 61.8% and 38.2%. Note that 38.2% is often rounded to 38% and 61.8 is rounded to 62%. After an advance, chartists apply Fibonacci ratios to define retracement levels and forecast the extent of a correction or pullback. Fibonacci Retracements can also be applied after a decline to forecast the length of a counter trend bounce. These retracements can be combined with other indicators and price patterns to create an overall strategy.
The Sequence and RatiosThis article is not designed to delve too deep into the mathematical properties behind the Fibonacci sequence and Golden Ratio. There are plenty of other sources for this detail. A few basics, however, will provide the necessary background for the most popular numbers. Leonardo Pisano Bogollo (1170-1250), an Italian mathematician from Pisa, is credited with introducing the Fibonacci sequence to the West. It is as follows:
0, 1, 1, 2, 3, 5, 8, 13, 21, 34, 55, 89, 144, 233, 377, 610……
The sequence extends to infinity and contains many unique mathematical properties.
1.618 refers to the Golden Ratio or Golden Mean, also called Phi. The inverse of 1.618 is .618. These ratios can be found throughout nature, architecture, art and biology. In his book, Elliott Wave Principle, Robert Prechter quotes William Hoffer from the December 1975 issue of Smithsonian Magazine:
….the proportion of .618034 to 1 is the mathematical basis for the shape of playing cards and the Parthenon, sunflowers and snail shells, Greek vases and the spiral galaxies of outer space. The Greeks based much of their art and architecture upon this proportion. They called it the golden mean.
Alert ZonesRetracement levels alert traders or investors of a potential trend reversal, resistance area or support area. Retracements are based on the prior move. A bounce is expected to retrace a portion of the prior decline, while a correction is expected to retrace a portion of the prior advance. Once a pullback starts, chartists can identify specific Fibonacci retracement levels for monitoring. As the correction approaches these retracements, chartists should become more alert for a potential bullish reversal. Chart 1 shows Home Depot retracing around 50% of its prior advance.
The inverse applies to a bounce or corrective advance after a decline. Once a bounce begins, chartists can identify specific Fibonacci retracement levels for monitoring. As the correction approaches these retracements, chartists should become more alert for a potential bearish reversal. Chart 2 shows 3M (MMM) retracing around 50% of its prior decline.
Keep in mind that these retracement levels are not hard reversal points. Instead, they serve as alert zones for a potential reversal. It is at this point that traders should employ other aspects of technical analysis to identify or confirm a reversal. These may include candlesticks, price patterns, momentum oscillators or moving averages.
Common RetracementsThe Fibonacci Retracements Tool at StockCharts shows four common retracements: 23.6%, 38.2%, 50% and 61.8%. From the Fibonacci section above, it is clear that 23.6%, 38.2% and 61.8% stem from ratios found within the Fibonacci sequence. The 50% retracement is not based on a Fibonacci number. Instead, this number stems from Dow Theory's assertion that the Averages often retrace half their prior move.
Based on depth, we can consider a 23.6% retracement to be relatively shallow. Such retracements would be appropriate for flags or short pullbacks. Retracements in the 38.2%-50% range would be considered moderate. Even though deeper, the 61.8% retracement can be referred to as the golden retracement. It is, after all, based on the Golden Ratio.
Shallow retracements occur, but catching these requires a closer watch and quicker trigger finger. The examples below use daily charts covering 3-9 months. Focus will be on moderate retracements (38.2-50%) and golden retracements (61.8%). In addition, these examples will show how to combine retracements with other indicators to confirm a reversal.
Moderate RetracementsChart 3 shows Target (TGT) with a correction that retraced 38% of the prior advance. This decline also formed a falling wedge, which is typical for corrective moves. The combination raised the reversal alert. Chaikin Money Flow turned positive as the stock surged in late June, but this first reversal attempt failed. Yes, there will be failures. The second reversal in mid July was successful. Notice that TGT gapped up, broke the wedge trend line and Chaikin Money Flow turned positive (green line).
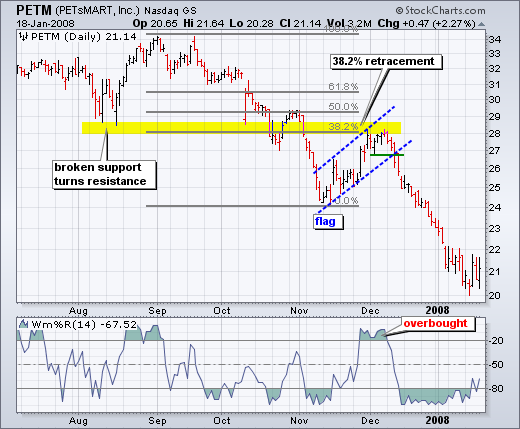
Chart 4 shows Petsmart (PETM) with a moderate 38% retracement and other signals coming together. After declining in September-October, the stock bounced back to around 28 in November. In addition to the 38% retracement, notice that broken support turned into resistance in this area. The combination served as an alert for a potential reversal. William %R was trading above -20% and overbought as well. Subsequent signals affirmed the reversal. First, Williams %R moved back below -20%. Second, PETM formed a rising flag and broke flag support with a sharp decline the second week of December.
Golden RetracementsChart 4 shows Pfizer (PFE) bottoming near the 62% retracement level. Prior to this successful bounce, there was a failed bounce near the 50% retracement. The successful reversal occurred with a hammer on high volume and follow through with a breakout a few days later.
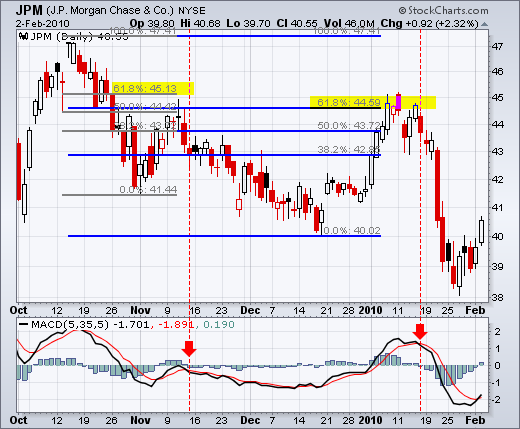
Chart 5 shows JP Morgan (JPM) topping near the 62% retracement level. The surge to the 62% retracement was quite strong, but resistance suddenly appeared with a reversal confirmation coming from MACD (5,35,5). The red candlestick and gap down affirmed resistance near the 62% retracement. There was a two day bounce back above 44.5, but this bounce quickly failed as MACD moved below its signal line (red dotted line).
ConclusionsFibonacci retracements are often used to identify the end of a correction or a counter-trend bounce. Corrections and counter-trend bounces often retrace a portion of the prior move. While short 23.6% retracements do occur, the 38.2-61.8% covers the more possibilities (with 50% in the middle). This zone may seem big, but it is just a reversal alert zone. Other technical signals are needed to confirm a reversal. Reversals can be confirmed with candlesticks, momentum indicators, volume or chart patterns. In fact, the more confirming factors the more robust the signal.
Strategy Video: Strategy For Low and Extreme Volatility Conditions
Volatility readings slid to extreme lows this past session - implying a correction in activity levels and markets may soon be at hand. From the equities-based VIX, a slide between 12 percent draws us to levels only seen two other times in the past seven years. Readings in FX and other financial assets have sported similar elevations. Our natural inclination is to project a reversal to match the magnitude of our current extremes. However, that eventual systemic change may take time and numerous false starts. There are more immediate opportunities for oscillations in activity levels. We look at this situation from a short, medium and long-term perspective while also highlighting the different trade options through the scale in today's Strategy Video.
VIX & VXN Volatility Indexes
The $VIX is the 30-day annualized implied volatility of the S&P 500 Index Options. In addition, the $VXN is the 30-day annualized implied volatility of the Nasdaq 100 Index Options. When markets crash or move downward quickly, put options become popular. Traders bid up the price of these put options, which manifests itself as an increase in the implied volatility level; thus an increase in the $VIX and $VXN index. The basic relationship between stock and index prices and the $VIX and $VXN is presented next:
This basic relationship is summed up by a famous traders' saying: "When the VIX is high it's time to buy; when the VIX is low it's time to go."
The following chart of the S&P 500 exchange traded fund (SPY), top half of chart, shows the inverse relationship between it and the $VIX Volatility Index, bottom half of chart:
Notice how an uptrend in the price of the S&P 500 is accompanied by a downtrend in the level of the $VIX.
The next chart of the Nasdaq 100 exchange traded fund (QQQQ) shows how great buying opportunities are when the $VXN spikes higher:
VIX & VXN Buy SignalWhen the $VIX or $VXN spike (usually they both spike during the same periods) buy. If history repeats itself, which it has done often, buying $VIX and $VXN spikes has proven quite profitable. Nevertheless, the Mutual Fund mantra applies: "Past performance is not indicative of future performance".
The trend of the $VIX and $VXN Indexes can add another helpful level of analysis to price and volume indicators. A technical indicator that might be of interest is the Volatility indicator