Custom Indicator - Floating Levels for RVI
Hello,
Have you looked at your log file?
I just changed to 301 and seems to work for me.
double RVIArray[300];
Your log file would have told you that the array was out of range. I hope that helps.
Also it might help if you use #property strict. You will see there is another problem.
I don't think you really need this.
#property      indicator_color1  Green
#property      indicator_color2  Red
You can just do this.
   SetIndexStyle(0,DRAW_LINE,2,2,clrYellow);
   SetIndexStyle(1,DRAW_LINE,2,2,clrRed);
This will set the line type and colour.
Thanks GrumpyDuckMan, I have been watching the live readouts in the terminal (still learning). I think I found the log files, but I am still trying to open them... 4gb each.. ouch. I found an article on how to limit log file sizes so that will be my next mini project later today.
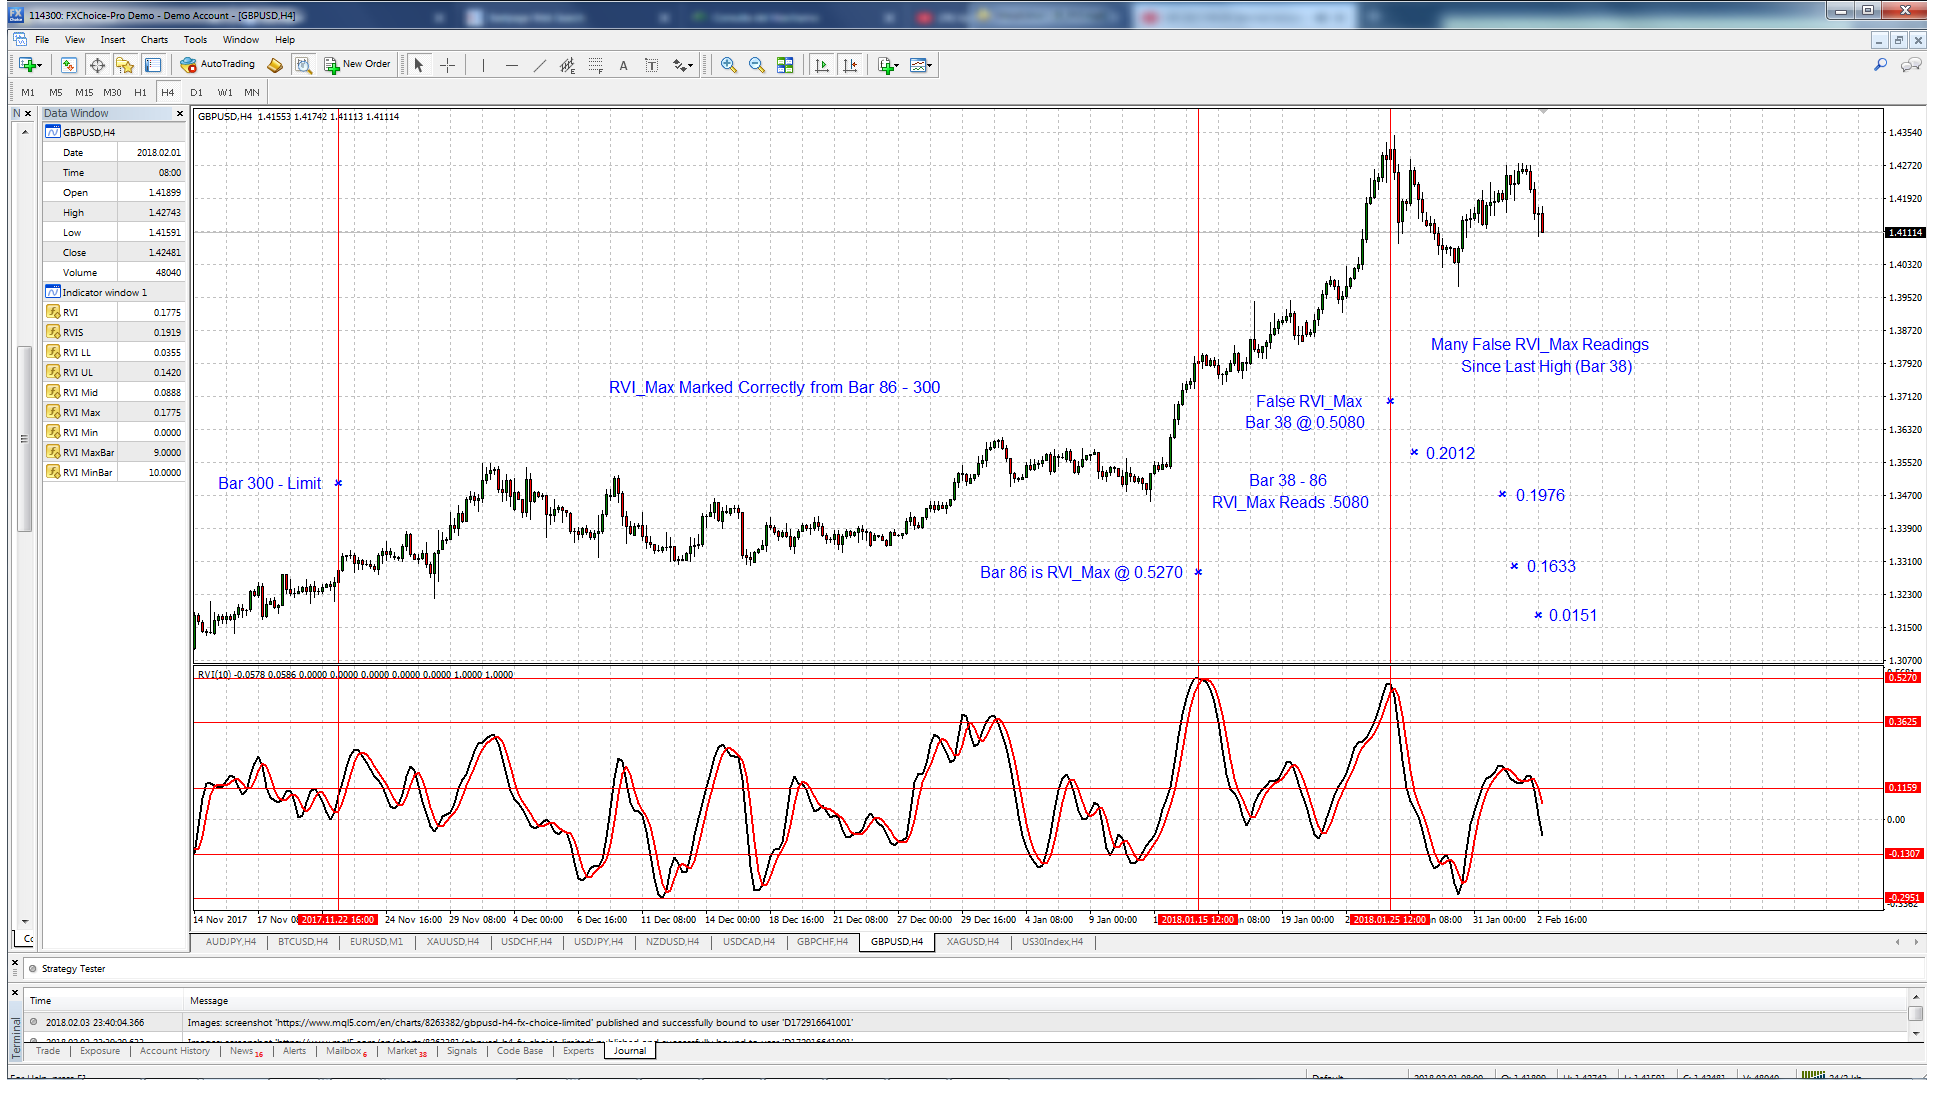
I changed RVIArray[300] to [301] but I didn't see any change on screen, but since I can't see the log files yet I will take your word for it. It makes sense though. But it doesn't look like it solved everything - see attached chart. The max/min levels for all bars before an extreme are marked correctly (although sometimes a false max/min is posted even if it is not the most extreme within 300 bars). But immediately after the most recent extremes the buffer tracks toward 0.00.
I seems to me that it is working somewhat for past data, but for current data it grabs the first value that is higher/lower than the current value (Bar 0). Is the ArrayMinimum() / ArratMaximum() able to operate correctly with an array set that is constantly updating in a for()? Maybe for each new value added I can check the current array at that point, update the buffer and re-draw the lines? I don't know, at this point I'm just trying random ideas and seeing if it helps.
After an even closer look, it looks like the output in the Experts tab where I have all the data printing shows the correct value (or very close to it). But the Data window shows incorrect data for the most recent bars. So i guess the real question is will an EA use the data-window values, or the buffer values in the log? My gut tells me the buffer values will be used, but since the variables being given for both are exactly the same I cannot say for sure. Any thoughts?
   Print("MAX BAR ", RviMax_Bar);  //This Block prints all values to log
   Print("MIN BAR ", RviMin_Bar);
   Print("RVI MAX ", RviMax);
   Print("RVI MIN ", RviMin);
   Print("RVI Range ",RviRange);
   Print("RVI ULimit ",RVI_UL);
   Print("RVI LLimit ",RVI_LL);
   Print("RVI MidLevel ",RVI_Mid);

   ExtRVI_MinBar_Buffer[x]=RviMin_Bar;  //This Block passes calculated values to buffers (not plotted)
   ExtRVI_MaxBar_Buffer[x]=RviMax_Bar;
   ExtRVI_Max_Buffer[x]=RviMax;
   ExtRVI_Min_Buffer[x]=RviMin;
   ExtRVI_UL_Buffer[x]=RVI_UL;
   ExtRVI_LL_Buffer[x]=RVI_LL;
   ExtRVI_Mid_Buffer[x]=RVI_Mid;
P.S. GrumpyDuckMan I finally see what you meant about your comments regarding #property strict. I have cleaned up some of the lesser errors and now see the problem with the other arrays in the code as well. Thank you for the advice.
Hello,
To see the log files you do this. (File/Open Data Folder/MQL4/Logs) make sure you look at the time and date it was created.
Maybe you might be able to use iCustom() to get you data OnTick();Alright I made some good progress and figured I would share what I have. The main thing was changing where the variables for the custom RVI levels are called. I guess you can call a variable for a for() iteration such as “x” for counting in the middle of the code, but calling variables that will be used to pass data to buffers needs to be declared at the top. Kind of seems obvious now, but there you go – lesson learned. This fixed the problem with incorrect buffer values being shown for certain candles within the 300 bar range. Now the buffer values are consistent for all bars, as they should be.
The drawing of the levels is still not how it should be, although the levels it draws when the indicator is loaded is correct. Eventually the idea is to have the actual buffers do the drawing, or at the very least have the ObjectCreate Horizontal lines update when new highs/lows of the RVI are made or old ones expire. Since the main goal for me is to use this in an EA, and since the buffers update correctly, this aesthetic task is not priority. So, this will work when you call this indicator through iCustom() in an Expert Adviser. But if you want to use the indicator visually you will need to remove and reload the indicator when lines need to be redrawn.
Also worth noting are a few quirks with this indicator that have popped up. First, when using this indicator for back-testing with an EA, it will load 3 or more versions of the indicator at the end (even if the back-test is in visual mode with this indicator already loaded). I’m not sure if this is just something that happens at the end, or if the EA I have is actually using three versions of the indicator during the test. The second quirk is that the back-tests using this indicator are very slooow. A test period of 2 years took a good 10 hours to complete where as all of my custom EA’s with more standard indicators take 10 minutes TOPS. So if anyone has any ideas of how I can make the code more efficient, I am all ears.
Anyway, I hope this helps someone out there and if anyone has any tips they would be greatly appreciated.
[Final Note: I have cleaned up the code a little bit, but this is still a work in progress. Therefore there is some unused code in there for features that have not been implemented yet or for testing purposes.]
- Free trading apps
- Over 8,000 signals for copying
- Economic news for exploring financial markets
You agree to website policy and terms of use
Hey everyone,
A few weeks ago, I undertook a personal project to automate my trading system. Progress is going surprisingly well for someone with minimal programming experience – mainly due to this forum and all of the available source code I was able to copy/paste from. I am at a point now, though, where I need a little help from someone with more expertise.
I am modifying the RVI indicator to add the following logic: Look back at the 300 most recent RVI main-signal values. Take the maximum and minimum values and use them to figure the midpoint, “overbought” (80%) and “oversold” (20%) levels for this 300-bar period. Mark the indicator with horizontal lines at these levels. These calculated levels should not change unless a new RVI max/min is being printed OR the previous max/min turns older than 300 bars. Once complete, this modified indicator will pass values to my EA via buffers.
But for some reason the values for bars 1-30 seem to jump around without a nearby max/min or max/min over 300 bars old. Can anyone see why these values seem to change contrary to the intended logic? I have a feeling it has to do with the for() statement as I am not super confident what exactly should go here.
Note: I am using ObjectCreate() to make the indicator lines and passing the same values to the buffers because I cannot figure out to have the indicator draw a straight line instead of plotting a curve when new max/mins are created. If anyone has any advice on how to draw the line and set the buffers in less code I am all ears. But at the moment getting the correct values into the buffers is priority #1.
Relevant code posted below and full source code attached.
Thanks for any help you can provide!