Renko Timeframe Changing Renko Chart
This is not a reply to your question but just the information about Renko I found on the forum -
Forum on trading, automated trading systems and testing trading strategies
Sergey Golubev, 2018.01.04 12:50
Free To Download: Renko indicator
and some more information is on the following thread.
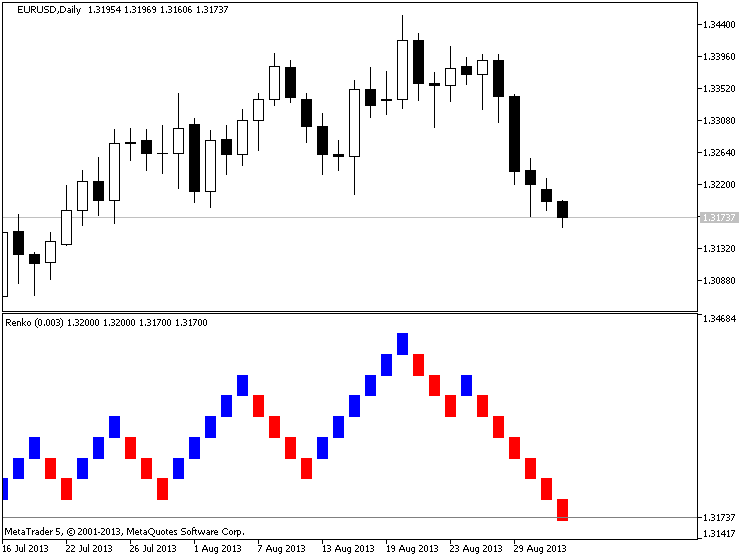
Forum on trading, automated trading systems and testing trading strategies
Sergey Golubev, 2013.09.03 11:03
Renko (extraction from Achelis - Technical Analysis from A to Z)
============
Overview
The Renko charting method is thought to have acquired its name from "renga" which is the Japanese word for bricks. Renko charts are similar to Three Line Break charts except that in a Renko chart, a line (or "brick" as they're called) is drawn in the direction of the prior move only if prices move by a minimum amount (i.e., the box size). The bricks are always equal in size. For example, in a 5-unit Renko chart, a 20-point rally is displayed as four, 5-unit tall Renko bricks.
Kagi charts were first brought to the United States by Steven Nison when he published the book, Beyond Candlesticks.
Interpretation
Basic trend reversals are signaled with the emergence of a new white or black brick. A new white brick indicates the beginning of a new up-trend. A new black brick indicates the beginning of a new down-trend. Since the Renko chart is a trend following technique, there are times when Renko charts produce whipsaws, giving signals near the end of short-lived trends. However, the expectation with a trend following technique is that it allows you to ride the major portion of significant trends.
Since a Renko chart isolates the underlying price trend by filtering out the minor price changes, Renko charts can also be very helpful when determining support and resistance levels.
Calculation
Renko charts are always based on closing prices. You specify a "box size" which determines the minimum price change to display.
To draw Renko bricks, today's close is compared with the high and low of the previous brick (white or black):
-
If the closing price rises above the top of the previous brick by at least the box size, one or more white bricks are drawn in new columns. The height of the bricks is always equal to the box size.
-
If the closing price falls below the bottom of the previous brick by at least the box size, one or more black bricks are drawn in new columns. Again, the height of the bricks is always equal to the box size.
If prices move more than the box size, but not enough to create two bricks, only one brick is drawn. For example, in a two-unit Renko chart, if the prices move from 100 to 103, only one white brick is drawn from 100 to 102. The rest of the move, from 102 to 103, is not shown on the Renko chart.
MetaTrader Trading Platform Screenshots
MetaQuotes Software Corp., MetaTrader 5, Demo
renko + candlestick

Here are my top 6 reasons of why I choose Renko Bars and charts:
- They REALLY help filter the noise
- They help smooth Indicators
- They can provide better entries
- They may help to provide smaller stops
- In my opinion they are just “cleaner”
- They help to filter noise and may help, keep us out of the chop.
- Do you really expect an answer? Humans can't read EX4.
- If it changes then it is generating the Renko from the current chart and not from all available lower timeframes.
Different Renko EAs build the charts differently: offline, online but in a second window, on the main window and then the bars are changed to black to be invisible in the background. Each will change the visualization of the chart somewhat, but only the offline charts should change if the Renko charts are built with 1 minute bar data. Older Renko chart EAs are not so reliable anymore (my experience anyway.)
There are good Renko chart builders in Market... just search the indicators for Renko and they show up. There are Renko robots too but I have not found any I could work well with.
Good luck.
There is the similar version for MT4, for example -
Renko Charts - indicator for MetaTrader 4There is the similar version for MT4, for example -
Renko Charts - indicator for MetaTrader 4Thanks Sergey!
Hi guys,
I'm relatively new to renko but I have attached a renko indicator which I downloaded. All you need to do is attach to a chart (no need offline chart). Please take a look. I use a 100 point (10 pip) box size to plot the charts. Could someone please explain why the renko chart changes with time frame? Does it use live market price? I thought renkos were based on price movement and not time. And it is not just different amounts of data in the different timeframes, it is literally different chart patterns as the timeframe is changed and i do't understand.
thanks in advance.
Hi,
I think you are referring to renko charts changes since the moment you start the indicator to back on time.
My explanation is this: renko draws bars depending of the box size, but selection different Time frames you are changing the detail of data that your indicator is getting.
I try to be clear with a simplified example.
Suppose you set your renko for drawing a bar every 10 pips.
Now you set the TF to 15M.
The indicator will begin to receive historical data. Let ' s analyze the 1° old bar ( TF15M): Open 1.1600, Min:1.1596, Max:1.1623,Close:1.1608
Renko indicator receive this 4 info: it doesn t know of MAX was reached before Minimum or viceversa. Only useful info are Open and Close. In this case it will draw only 1 bar because difference between open and close are just 8 pips and they are not enough to draw a second bar. Obviously the chart is missing information because if the max is 1.1623 it means you should have 3 bars: 1.1600->1.1610, 1.1610->1.1620,1.1620->1.1630.
This is how TF affects Renko chart.
Solution: use lower TF as you can.
Hi guys,
I'm relatively new to renko but I have attached a renko indicator which I downloaded. All you need to do is attach to a chart (no need offline chart). Please take a look. I use a 100 point (10 pip) box size to plot the charts. Could someone please explain why the renko chart changes with time frame? Does it use live market price? I thought renkos were based on price movement and not time. And it is not just different amounts of data in the different timeframes, it is literally different chart patterns as the timeframe is changed and i do't understand.
thanks in advance.
you know that renko based on price not on the time it is half truth
box size and number of box formed is independent of time only depend on price
but greyed box become permanent box is time dependent
means that if you use indicator on renko chart it depend on the permanent boxes not the greyed boxes so indicators seems good in backtest in renko actually fail in real trade situation
suggestion -use smallest time frame means in seconds then use small boxes for momentum trading or small and frequent trading or use smallest time frame with large box size for trend based trading
thank me later...............
- Free trading apps
- Over 8,000 signals for copying
- Economic news for exploring financial markets
You agree to website policy and terms of use
Hi guys,
I'm relatively new to renko but I have attached a renko indicator which I downloaded. All you need to do is attach to a chart (no need offline chart). Please take a look. I use a 100 point (10 pip) box size to plot the charts. Could someone please explain why the renko chart changes with time frame? Does it use live market price? I thought renkos were based on price movement and not time. And it is not just different amounts of data in the different timeframes, it is literally different chart patterns as the timeframe is changed and i do't understand.
thanks in advance.