MACD graphic representation
whroeder1:
|
whroeder - thank you for your response: -
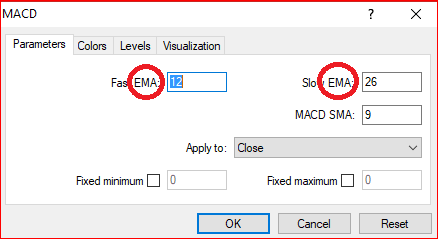
1/ then please WHY is the selection box (below your red highlit "Slow EMA") labeled "MACD SMA"? - it is this I require as an EMA
I am well aware that it is more commonly known as the "Signal Line" but thought it more appropriate & sensible to use the terminology being used by the MT5 package!
2/yes - I may - but I sincerely thought that is what I WAS doing by posting my questions?... OK - so I'm not a genius programmer or whizz-kid but perhaps a suggestion link to try would have been preferable.
Regards, Bebbspoke
John Bebb: it is this I require as an EMA
|
|
You are missing trading opportunities:
- Free trading apps
- Over 8,000 signals for copying
- Economic news for exploring financial markets
Registration
Log in
You agree to website policy and terms of use
If you do not have an account, please register
Hello Peoples; -
This req refers to the MACD graphic as displayed in both MT4 & MT5 current versions:
The MACD is displayed as standard by a line and histogram: - where Line = MACD as SMA variable / Histogram = Fast & Slow as EMA variables.
TWO variants I would like to achieve: - (such as are available on the freestckcharts package...)
1/ that Line = MACD to bcome an EMA variable.
&
2/ that Histogram is represented only as a Line drawn which follows the peak / trough level of the individual bars.
Should such MT4 or MT5 variant(s) already exist, please supply the appropriate link(s), thank you.
John (aka Bebbspoke)