40-100 pips aday
Hi there James here
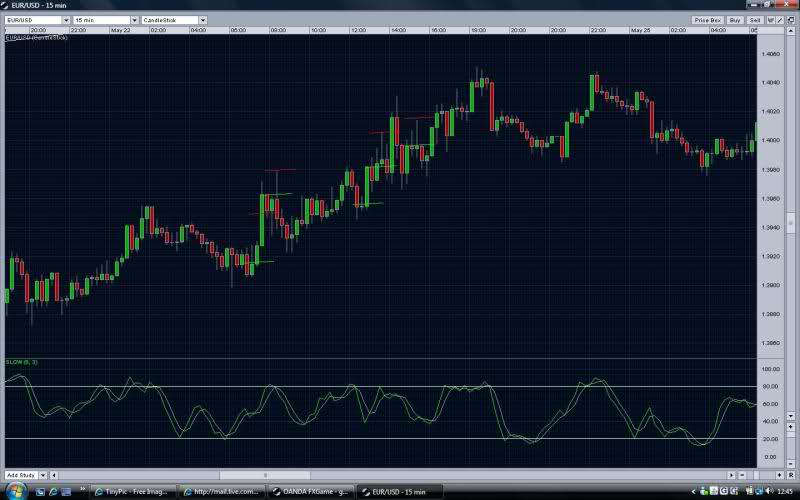
Here some of the trades we did on friday 3 nice little one as the market is still choppy.
See below
Now if you want to cut out some of the noise and stay in the trade longer try this, use a 30 min chart and stick a fib on the high and low of the past day and wait for a retrace to the 50-62% fib levels only trade with the trend and target the nearst support or the top or bottom of the fib level depending on direction of the fib level you may only get 1 trade every day or 2 days depending on the market the yellow lines are target 1 and 2
see below 2 nice trades you could of taken today
Regards
James
Hi there James here
Some more trade eg from last week
Well yesterday was ok in the room took 1 trade for 30 pips and also missed a good move.
Today I took 4 trades on the euro/jpy SEE BELOW plus all target were met in the other pairs traded by othe members for between 60-100 what members told me some may have taken less
Here Are my trades GREEN ENTRY / RED EXIT
1st TRADE 40 PIPS
2ND TRADE 30 PIPS OTHER MEMBERS TOOK 110 PIPS ON THIS ONE
I MISSED IT.
3RD TRADE 25 PIPS
4TH TRADE 50 PIPS
Regards
James
Here are some of the trades we took today in the live lounge The green lines are entry and red lines are exits
£/$
1st trade 32 pips
2nd trade loss of 9 pips
3rd trade 38 pips
4th trade 60 pips the last trade did go to target higher up but some members closed lower
Euro / Usd
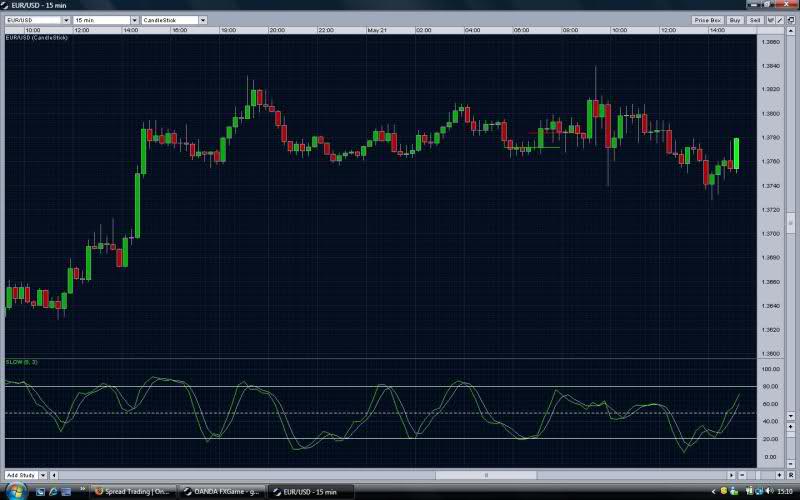
1 Trade 12 pips
Euro / JPY
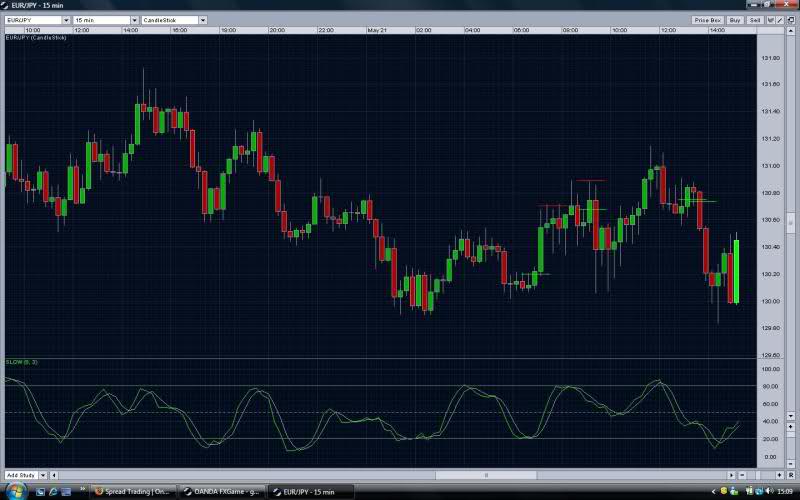
1st Trade 50 pips
2nd Trade 21 pips
3rd Trade Breakeven
Regards
James
Hi there James here
Here where the trades i did today
1st trade we where stopped out for 7-8 pips the 2 blue lines
2nd trade + 50 pips
3rd trade + 40 pips
see below
Regards
James
Hey jimbo,
Just letting you know I've had some success w/ your method.
The latest chart you posted seemed confusing to me. I guess I'm not seeing the IB' candles per your entry.
Could you further clarify?
thanks,
revrobwimb
hello my dear friends,
I m a newbe. Hope to learn more about forex in this forum.
looking for someone pro to teaches.
Hey jimbo, Just letting you know I've had some success w/ your method. The latest chart you posted seemed confusing to me. I guess I'm not seeing the IB' candles per your entry. Could you further clarify? thanks,revrobwimb
Hi there revrob
This is what i call an IB2 look at the instructions above will explain
Regards
James
Hi again james,
Thanks I see the IB2 entries now.
How do I join you for live trading?
revrobwimb
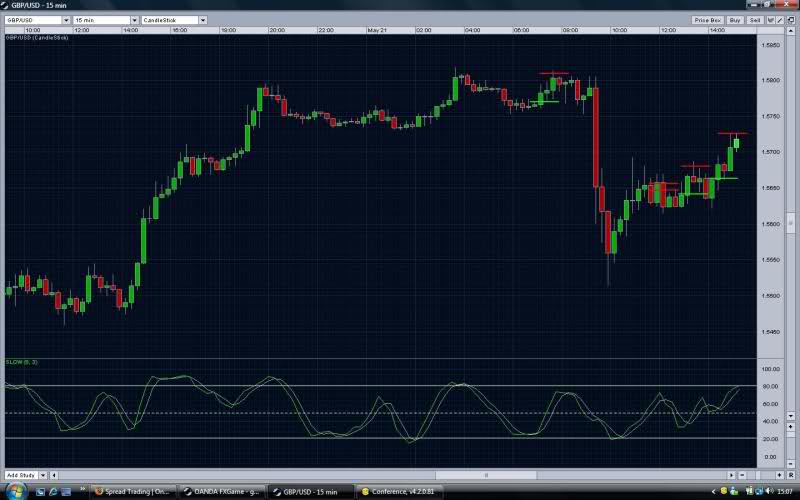
Hi there James here
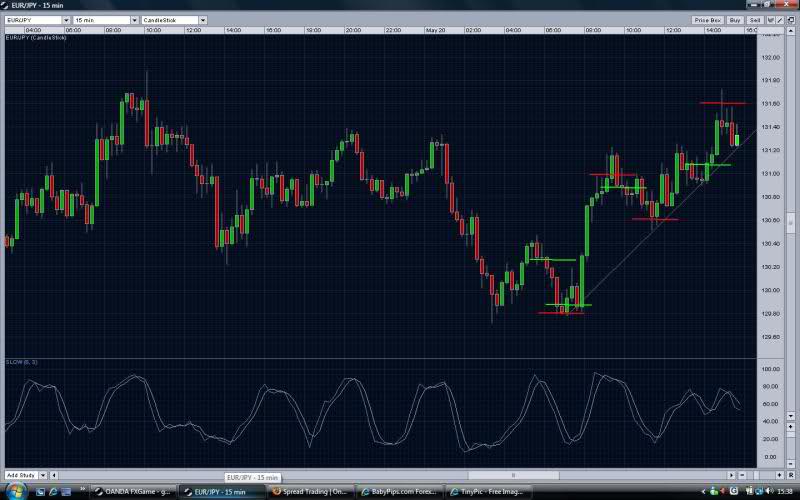
Here are some of the trades members took today some good trades on the euro/jen 1 loser for 6 pips was classed as high risk other members took other pairs a well and i took 1 trade in the gbp/jpy for 59 pips as well and 1 in the euro/jen for 23 pips. Point 1 is were some closed 1/2 the trade and point 2 all the trade
see below
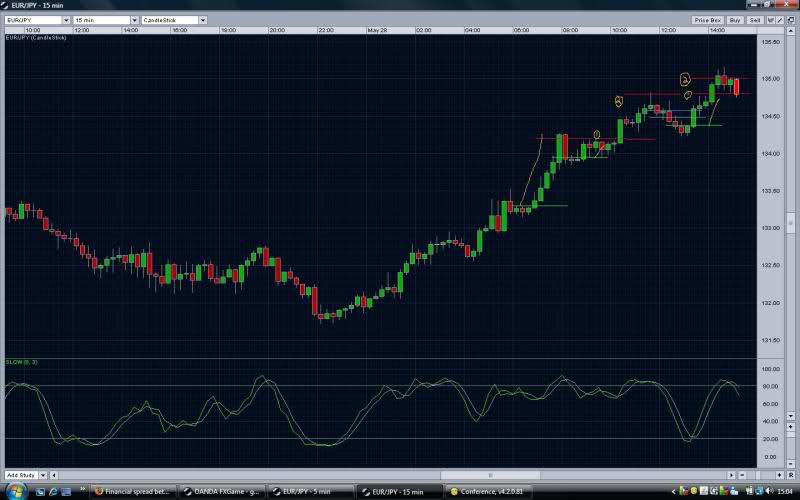
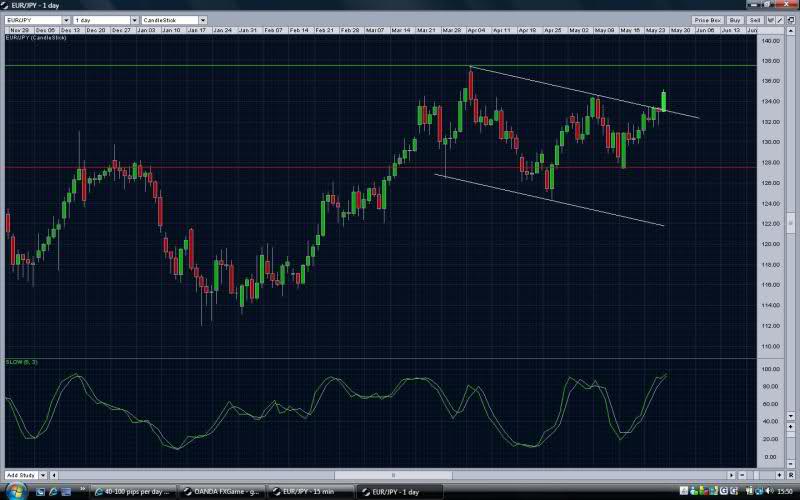
Now for tomorrow we could see a move you to the green lines now resistance has broken targets are 137.50 then if broken a move up to 142.00 the red line is a possible pull back erea if price comes back inside the white lines to 127.50
Regards
James
interesting
- Free trading apps
- Over 8,000 signals for copying
- Economic news for exploring financial markets
You agree to website policy and terms of use
Hi there James here
This is a simple and easy yet very affective trading style i would like to share with you
IB TRADING
This system is very simple and requires one indicator.
The system works in anytime frame and with any pair
The Indicator you need is Slow Stochastic setting 8.3.3 some platforms will only allow 8.3 that’s ok.
Next the key part of the system in all trades is the INSIDE BAR or IB
An IB is simply when the current bar is less than or equal to the bar to the left of it. The inside bar can also be the same size as the previous bar.
HOW TO TRADE THE IB
First look for an IB to form then check if it’s a valid IB with the stochastic indicator set up.
STOCASTIC INDICATOR SET UP
when stochastic are below or around the 20 and oversold and starting to hook round look for an IB to go long, When stochastic are up to 80 and above and starting to hook round in overbought look for an IB to go short you will find them the best in trending markets also range bound markets but if the price action is choppy stay out.
The Stochastic don't have to be exactly 80-20 but it is stronger signal if they are. Sometimes as an example they may at 35 as long as they start to turn and hook up and an IB forms it’s a possible valid trade.
To enter a trade wait for the next bar after the IB to go up 1-2 pips higher than the IB for a buy signal or 1-2 pips lower for a sell signal.
Also the shadow of the IB must be inside the prior bar as well in the overall size otherwise it’s not a valid signal.
If after the IB formed you get another bar the same size as the IB and it doesn’t go 1-2 pips either way then you may look at up to 3 more bars after the IB bar to confirm a signal and enter a trade. If you don’t get a signal stand a side and wait for a new IB to form.
STOPS & EXITS
For stops and exits you can trail a stop at the bottom of the prior bar to the IB by 1-2 pips if you’re more Aggressive 2 bars below the prior bar to the IB.
Exit when stochastic cross in the opposite direction but becarefull when going long as when stochastic hits 80 it can hang around a while first before carrying on up or just staying flat in a strong up trend so wait for a hook down and heading under the 80 level or a reversal candle to exit.
Also to exit look for the big numbers if you were trading GBP/USD for example look for the market to turn around at 1, 9000 / 1, 9050
Try not to enter trades around the big numbers wait for price to go through and retrace to the support or resistance then look for an IB to form and take the trade.
I look at a 1 hour chart first and see what the over all trend for the day is going to be then trade off a 15 min chart for the day If your new to trading trade with the trend.
Regards
James