Why this price changed on this way?
MetaTrader Trading Platform Screenshots
MetaQuotes Software Corp., MetaTrader 5, Demo
Why this price changed on this way?

Just about why we had uptrend for EURUSD in GNT morning ... I do not know exactly but if we will see it concerning fundamental analysis - my explanation is the following.
=========
Fundamental Analysis
We had few news events in the morning:
- PMI Manufacturing
- PMI Services
=========
This index reflects the business optimism in the service sector. The indicator is calculated based on interviewing of executives in Germany, France, Ireland, Italy and Spain. Together, these countries account for about 4/5 of all activity in the service sector of Eurozone.
The indicator values about 50 points indicate that during the reporting period there was neither extension no reduction of the service sector. Values above 50 indicate growth in this sector. Figures below 50 may indicate deterioration in the service sector.
Because 2/3 of GDP is created in the service sector, PMI Services is an important and timely indicator of health of economy. The index has a significant impact on the market.
- Release Frequency: monthly.
- Release Schedule: 09:00 GMT, the third working day of the month.
=========
This index assesses business conditions in the manufacturing sector. Because the manufacturing sector represents nearly a quarter of the total Eurozone GDP, the Eurozone PMI Manufacturing is a significant and timely indicator of business conditions and the general health of the economy.
The indicator values about 50 points indicate that during the reporting period there was neither extension no reduction of the manufacturing sector. Values above 50 indicate growth in this sector. Figures below 50 may indicate deterioration in the manufacturing sector.
- Release Frequency: monthly.
- Release Schedule: 09:00 GMT, the first working day of the month.
=========
General rule to use PMI (HowTO with PMI) :
if actual > forecast = good for currency (price is moved on the side of currency (example - if good for EUR so EURUSD is going to uptrend)
=========
For now - we can look at economic calendar in MT5 :
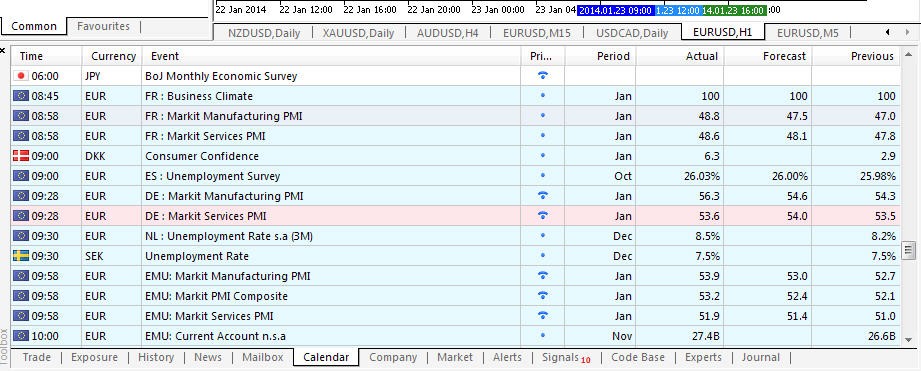
We see that there were the following PMI news events this GMT morning :
- French Manufacturing PMI
- French Services PMI
- German Manufacturing PMI
- German Services PMI
- EUR Manufacturing PMI
- EUR Services PMI
Every single PMI news event is not high impacted one (by definition) - this one news can not move the price a lot to any side - those news events are low/medium impacted. But those news events all together can give some good effect on price movement.
As we see from MT5 economic calendar - all PMI news events had actual data > forecast. It means - EURUSD had uptrend because of that.
=========
Next news event for this morning is EUR - Current Account
This news event is having same with PMI HowTo use it : if actual > forecast = good for currency (currency is EUR in our case).
If we look at MT5 economic calendar so we se that forecasting data was 19.2B and actial one was 23.5B
Actual was more than forecasting by value which moved EURUSD pair more and more to upward.
=========
So, the combination good (for EUR) fundamental news events made this price movement for EURUSD :
Just about why we had uptrend for EURUSD in GNT morning ... I do not know exactly but if we will see it concerning fundamental analysis - my explanation is the following.
=========
Fundamental Analysis
We had few news events in the morning:
- PMI Manufacturing
- PMI Services
=========
Technical Analysis
It is easy for me to provide analysis using Ichimoku but there are a lot of more ways to make this technical analysis:
- Ichimoku
- Moving Averages indicator
- Digital Filters
and more
=========
Concerning Ichimoku :
Chinkou Span line crossed the price from below to above (see image below), besides - Tenkan line crossed Kijun line for uptrend as well :
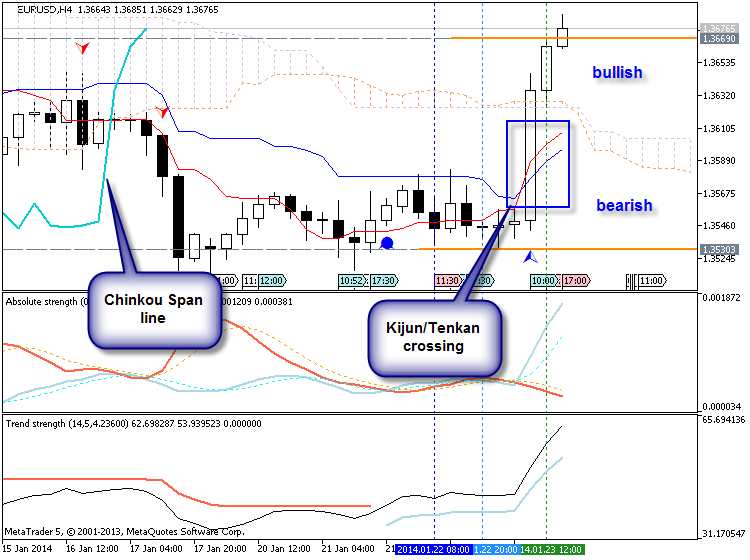
It was breakout
moon phase? astro?
I am sorry - I am not professional with it. But there are 2 websites where we can read about astro :
It was breakout
What I mean is: this technical analysis could in some way be related to this news before you know the news?
Thus, full analysis of the pair = fundamentals + technicals
=========
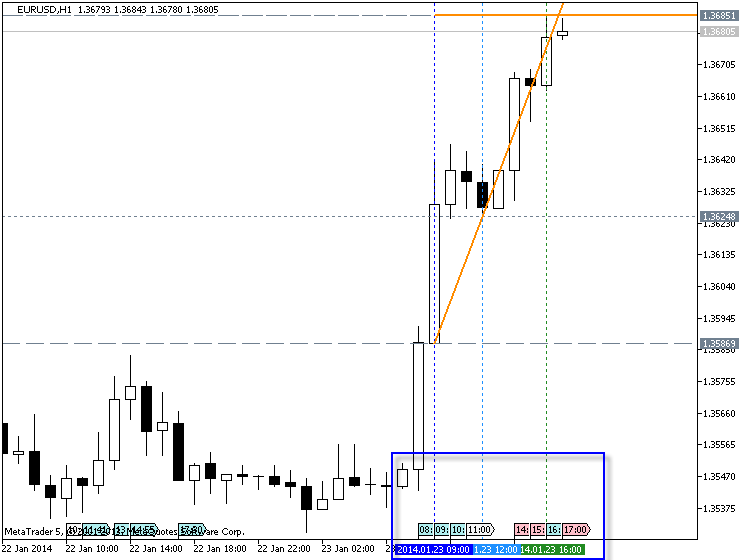
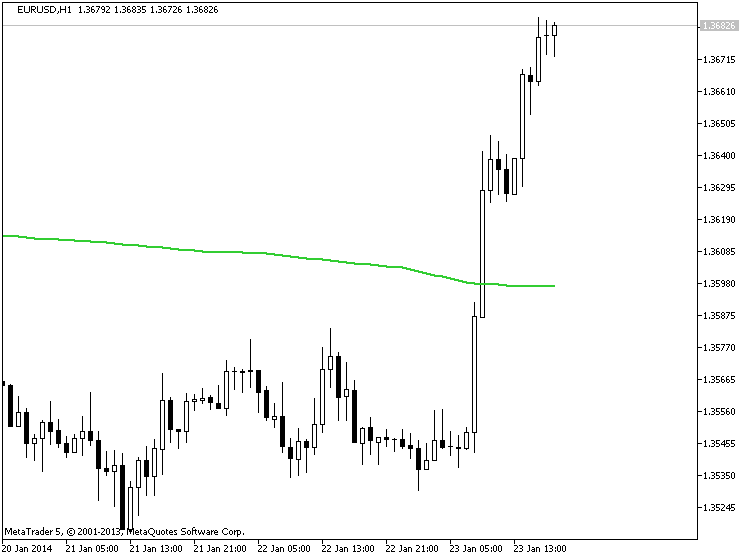
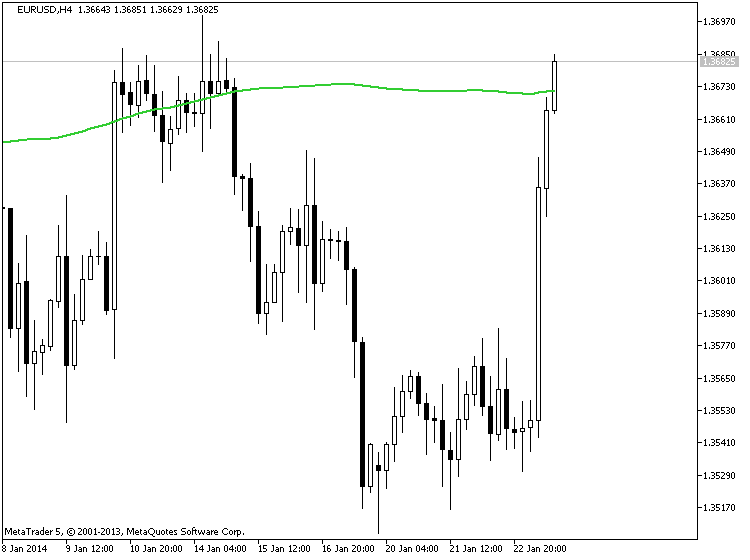
If we do not want to complicate our life with the rules of Ichimoku indicator - we can use just one Moving Average indicator with the period 200 (SMA 200):
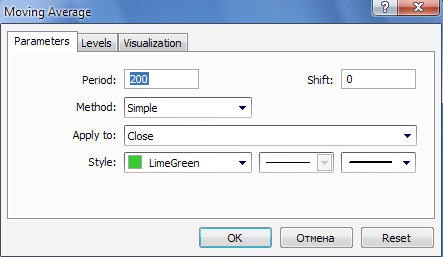
The price is on bullish if above SMA 200 - it is bullish zone, below this line - bearish.
This is example of EURUSD for H1 and H4 timeframe :
moon phase? astro?
I am sorry - I am not professional with it. But there are 2 websites where we can read about astro :
Anyway, this was just to break the ice and any fear of someone shares another outlier ideas!
By the way, someone with some different vision, for instance technical indicators that could lead to this, a quantitative model to predict price movements, a correlation to moon phase transition, or maybe another fundamental vision?
The topic is "Why price change this way ?". It's simple : because there are a lot of buyer who enter in the market.
- Fundamentals analysis can (maybe) tell you why buyers enter the market.
- Technical analysis can't tell you anything about "why".
- Astrology is pseudo-science and can only be a deception about trading (or anything else).
- Free trading apps
- Over 8,000 signals for copying
- Economic news for exploring financial markets
You agree to website policy and terms of use
What about create an topic to analyses relevant market movements and price changes?
The idea is quite simple: a group reverse engineering of the market (explore the cause-and-effect relationships underlying price changes).
So, bring a picture of some instrument graph (using MT5, for sure) and the community tries to explain the reasons.
We will find here all kind of reasons, for instance, random factors, technical and fundamental analyses, and so on ...
Anyone can use pictures to explain point of views, too.
I think we all can learn a lot from this, and get new ideas to code in our trading systems.
Please, folow our rules:
1) Follow the Forum rules
2) Don't forget brainstorming spirit
3) Forget the paradigms, when possible (start with a clean graph, without any indicators, is a good practice, for instance)