Discussion of article "Creating Non-Lagging Digital Filters"
The idea of building a non-lagging filter has been occupying me for the last couple of years. I've also been getting regular results that seemed better than others, and even non-lagging. All of them broke down in a step analysis. I ask the author to realise the input model signal as a Heaviside function: a step, up to moment T level =0, after one. And show the filter line on this. I am 99,99% sure that we will see a curve going to level 1 for some time interval, that is lag. An ideal, true, non-lagging filter should be able to handle the "steps" so that the output is equal to the input. If this is not the case, reasoning about "non-latency" is tinkering. Although I support the author: creation of a non-lagging, non-drawing filter is possible.
P.S. Comparisons with other filters should be given on a "step", placing all filters on one graph.
P.P.S. If this is already done in some video - please excuse me, at the moment (from a working computer) I can't see the video (apparently, posted on youtube ?).
I will add a test with a step for Momentum with a filter.
What is the reaction of the filter to the steps in the quotes flow can be clearly seen in the fourth video.
Let's say that the period in some effective (not literal) sense of averaging is 101 bars, hence the lag is 50 bars. And on a clean step I can see that very well. But on the quotes, where two horizontal sections (0 and 1 conventionally) taken together are only 20 bars, and around - quotes - there I will not see anything like that.
The filters should be investigated by inputting ONLY model signals, and after that, after understanding their nature, enjoy the pictures of work on the quotes.
Let's say the period in some effective (not literal) sense of averaging is 101 bars, hence the lag is 50 bars. And on a clean step I can see that very well. But on the quotes, where two horizontal sections (0 and 1 conditionally) taken together only 20 bars, and around - quotes - there I will not see anything like that.
The filters should be investigated by inputting ONLY model signals, and after that, after understanding their nature, enjoy the pictures of work on the quotes.
I got it, I'll add such a test.
Thank you. I'm guessing what we'll see. Maybe your filter will show less lag with better smoothing than the competition. But it will 100% not be a non-lagging, non-drawing filter....
Let's wait for the publication of GMomentum_test indicator to draw conclusions not on guesses. It was supposed to be published together with the article, but apparently they did not have time to prepare it. Now it seems to be published on Monday.
As for tests in general, tests for linear filters are not suitable for cluster filters. More precisely, they can be done, but they are not indicative, because cluster filters are nonlinear. An example of this is the situation with a single pulse from the article. Most likely, a test with a single step function would turn out to be just as spectacular. But it will be, just as with the single pulse, just an amusing special case of smoothing. Nothing more.

- 2013.10.07
- Timur Gatin
- www.mql5.com
Let's wait for the publication of GMomentum_test indicator, so that we can draw conclusions not on guesses. It was supposed to be published together with the article, but apparently they did not have time to prepare it. Now it seems to be published on Monday.
As for tests in general, tests for linear filters are not suitable for cluster filters. More precisely, they can be done, but they are not indicative, because cluster filters are nonlinear. An example of this is the situation with a single pulse from the article. Most likely, a test with a single step function would turn out to be just as spectacular. But it will be, just as with the single pulse, just an amusing special case of smoothing. Nothing more.
Here's what I got:
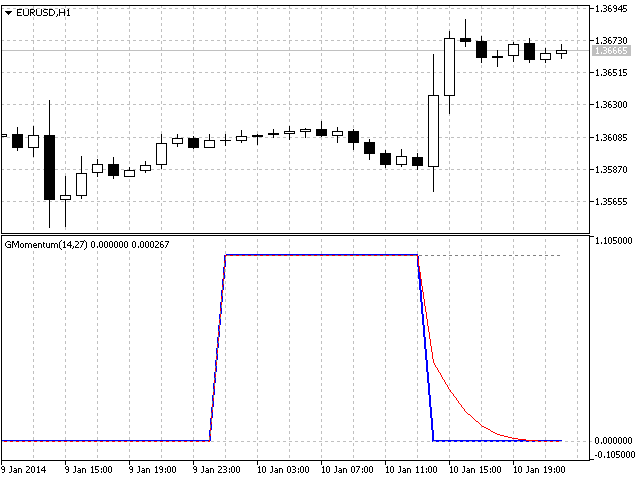
The grey dotted line is Heaviside, the blue thick line is Momentum, and the red line is Momentum with the filter on
Here's what I got:
The grey dotted line is Heaviside, the blue thick line is Momentum, and the red line is Momentum with the filter on
- Free trading apps
- Over 8,000 signals for copying
- Economic news for exploring financial markets
You agree to website policy and terms of use
New article Creating Non-Lagging Digital Filters has been published:
The article describes one of the approaches to determining a useful signal (trend) in stream data. Small filtering (smoothing) tests applied to market quotes demonstrate the potential for creating non-lagging digital filters (indicators) that are not redrawn on the last bars.
Cluster Filter
Cluster filter is a set of digital filters approximating the initial sequence. Cluster filters should not be confused with cluster indicators.
Cluster filters are convenient when analyzing non-stationary time series in real time, in other words, stream data. It means that these filters are of principal interest not for smoothing the already known time series values, but for getting the most probable smoothed values of the new data received in real time.
Unlike various decomposition methods or simply filters of desired frequency, cluster filters create a composition or a fan of probable values of initial series which are further analyzed for approximation of the initial sequence. The input sequence acts more as a reference than the target of the analysis. The main analysis concerns values calculated by a set of filters after processing the data received.
Figure 1. The diagram of a simple cluster filter
In the general case, every filter included in the cluster has its own individual characteristics and is not related to others in any way. These filters are sometimes customized for the analysis of a stationary time series of their own which describes individual properties of the initial non-stationary time series. In the simplest case, if the initial non-stationary series changes its parameters, the filters "switch" over. Thus, a cluster filter tracks real time changes in characteristics.
Author: Konstantin Gruzdev