Anyone have ideas or examples to score the resonance of a Trendline to Pivots, OHLC?
"Resonance" In Forex
Hi Pips4Life,
Interesting strategy... I searched for "resonance" in Forex and did not find very much.
The closest I came was finding Gann Fans and Fibo Fans...which seem to work from the current bar into the past. Your example seems to do the opposite...starting the pivot lines in the past and bringing them forward...
Can you explain a little more what your "resonance" is and how you determine it?
Also how do you select the pivot points and lines to start the fan...and when do those lines change?
And what is the basic strategy proposed...trend following, breakout, or what...?
Knowing these would help to figure out how to score the lines so it can work with an EA...
Thanks and good luck with this strategy
Robert
Hi Robert,
Thanks for the reply. I was away for a day, so sorry for my delay. The post #1 was viewed over 100 times before you took the time to make the first comment, so much appreciated.
The "resonance" I described refers to lines which show multiple hits that serve as Support and/or Resistance. It's hard to be very specific, although it's usually visually obvious to the naked eye.
The most common contributor to resonance would be exact hits to pivot highs and/or lows. The more the better. However, I have seen examples where a line of resonance passes through a point at which the market makes an obvious change of behavior, and picks up speed to get to a new level. It isn't always a pivot, but it just takes off from that point. Gap opens are another key point of resonance. Large bars (larger than average) often terminate or begin from a resonant line, so it's something else to watch for.
To some extent, a good way to learn about resonance is to work backwards to figure out what worked in the past. With practice, one can spot some of the more obvious bar configurations to the setup, but it's rather tedious to do all the time by hand, hence my desire to automate the measurements of resonance.
The best way to work "backwards" is to look at various Andrews pitchforks. There are plenty of examples posted on forums. ( I follow the "Andrews Pitchfork (Median Line)" thread on ForexFactory, but I'm sure there are others). Or you can just draw Andrews pitchforks using any three major pivots, normally high-low-high, or low-high-low. Usually the pivots are the extreme price pivots, but sometimes you might move pivot 2 to an earlier less-extreme pivot if it helps to capture more of the price-action within the total width of the fork. (See my AUDUSD example in post#1).
When you look at such pitchforks (preferably Andrews rather than Mod.Schiff or other variations), give careful attention to resonance along the MedianLine that occurs between the first and last pitchfork points (what I call intra-fork resonance). If you watch for it, you will spot many examples of resonance. Of course it doesn't always happen, but I'm interested to detect the ones that do, and trade the formation of point 3.
As such, this style of trading is counter-trend. One is looking for where the Andrews pt3 will form, and take a counter-trend trade when the resonance to the MedianLine is strong. The risk can be relatively tight. If it holds with precision, it's likely to play out well, with a big reward. If it doesn't hold, there is often a chance to bail quickly at B.E.
Here's yet another example, but by no means one of the very best. I picked a random currency (NZDUSD), spotted some pivots on the Daily that would be good to draw on a pitchfork or two, and did so. As often happens, the fork shown here is one that shows several intra-fork hits to the Andrews MedianLine. It's close to a couple of major pivots and a few OHLC prices. Pt3 of the fork formed where it did -- I claim -- in part because of the resonance to the MedianLine.
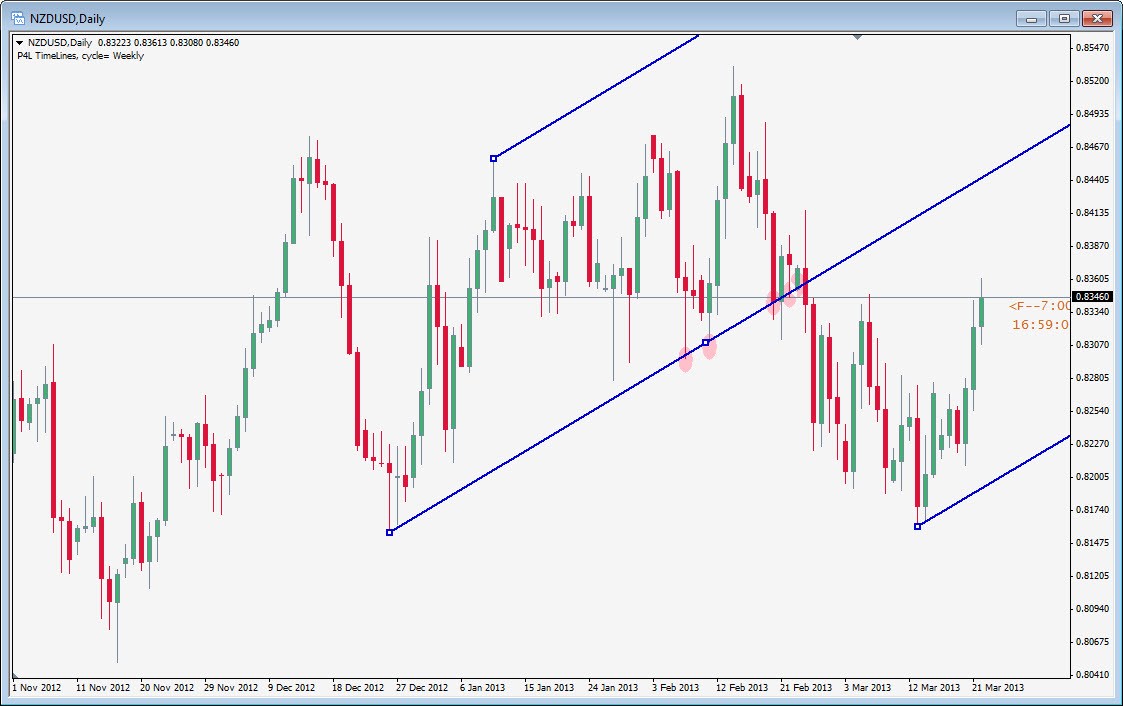
As an experiment, draw this same pitchfork on your own chart. Now drag pt3 backwards (to the left) bar by bar. Do you see other places where there was "resonance" that jumps out at you along the MedianLine? Is so, leave the fork where it is, and see whether there was a bounce that occurred when price reached the Lower-MedianLine. In my opinion, the pullback JUST PRIOR to the bottom showed good resonance and bounced +90pips. The two previous major up-pullbacks had some resonance, but honestly not much that I say would have stood out for me, compared to other random lines. As with any method, you wait for the best setups and ignore the rest.
Kent
As further examples...
Here are 3 independent Andrews forks drawn on NZDUSD,Daily.
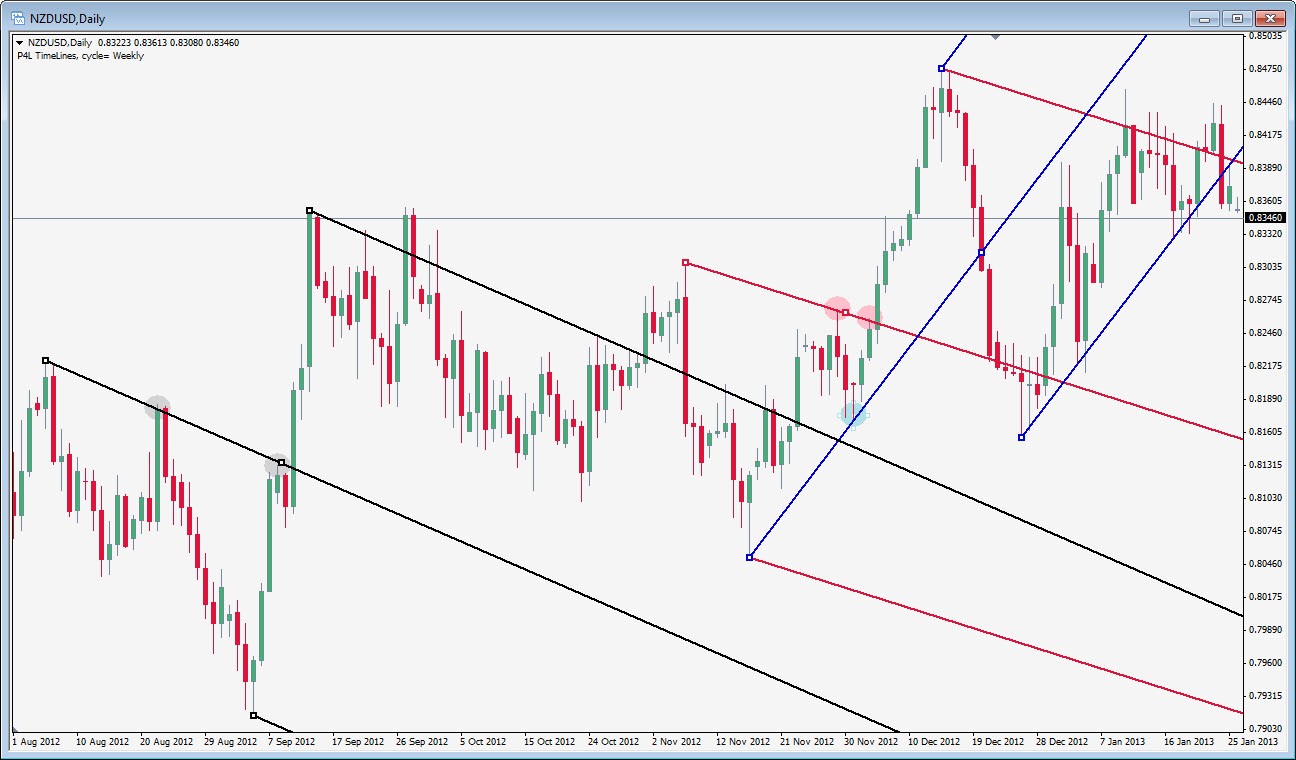
The first black fork has a couple of resonant areas circled in gray. The first gray circle, while not great, is the Close of a very large bar, with a small overshoot. Ideally, it would have resonated with the High instead of the Close, but it is what it is. The 2nd gray circle is close to the high of the very strong rise from the bottom.
The red fork has two pink circles around its intra-fork resonance.
The blue fork has just one light blue resonance circled, but it's a Daily pinbar, and the beginning of a huge string of green Daily bars.
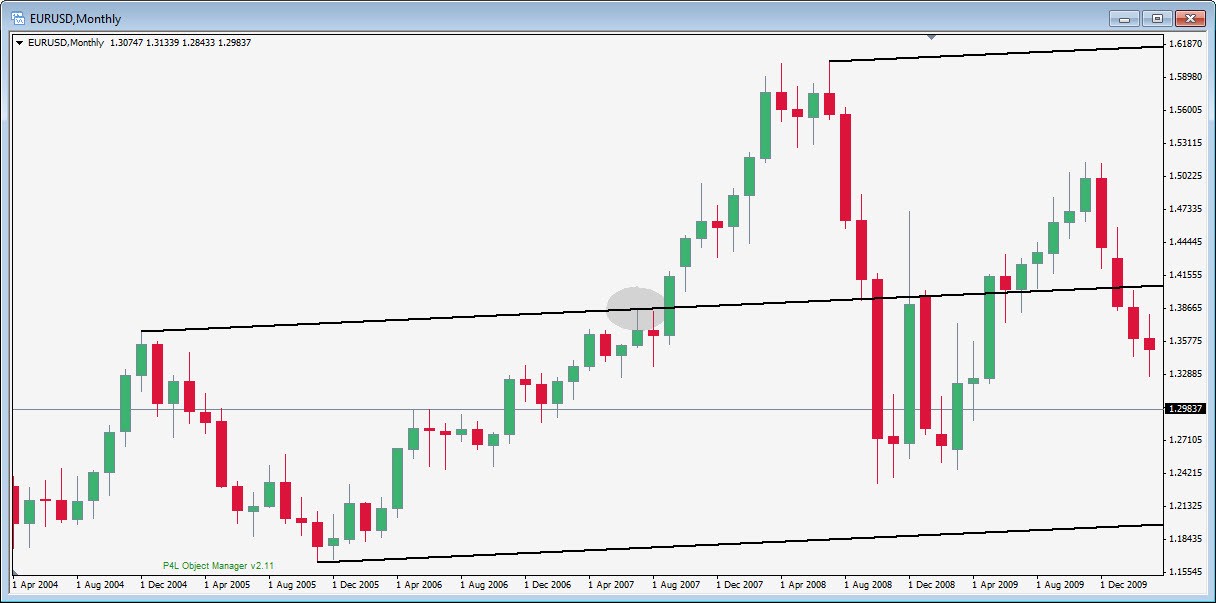
This method works across all timeframes, and I normally watch D1 and lower. But for kicks, here's even a Monthly EURUSD example:
Hi Kent,
Interesting ideas... However it's such new ideas and so much all at once that I'm getting a little lost in all the detail.
It will take a few more reads to let it all sink in. In the meantime...
I do like trend lines and just started playing with Andrew's Pitchfork that I'm just learning...so the following are more questions than suggestions.
If I understand it correctly...you define "resonance" as "lines which show multiple hits"...and those "hits" could be "close to or passes through a point on a line".
Those points are not necessarily a pivot point but would add weight (score) to the line if they are... Is this correct so far?
Your median line example with the Andrew Pitchfork helps show this...but your original example showed lines as a "fan"...so I don't have any idea on how to start drawing the lines yet..or which set of trend lines I should use for the lines instead of drawing them.
So...until I fully understand your strategy further...In order to set up a "scoring system"...I have a few novice questions...
What is the basic criteria of how a line or fan is formed (start line drawing where/when/why?) and how to expand it? To turn it into an indicator or EA...drawing the lines and recording the "hits" needs to be more systematic and not just "visually obvious"... And someone would need to know how to draw the lines consistently before they can start giving the "hits' weights for scoring.
Once you have your lines drawn consistently...what criteria and reasons do you give "weights" to your "hits"...closeness, crossing, touching, multiple touches...or what and why?
And once you have your "scoring weights"....how is this criteria to be used to make your Buy/Sell strategy?
My apologies if you have already answered these in your posts...but a quick checklist approach would be very helpful to get the strategy down to it's basics.
Hope this helps you stimulate your ideas...
Robert
My responses are embedded below in blue:
Hi Kent,
Interesting ideas... However it's such new ideas and so much all at once that I'm getting a little lost in all the detail.
It will take a few more reads to let it all sink in.
I agree that will help. There is a lot of detail in my posts, but the heart of the idea is there.
In the meantime...
I do like trend lines and just started playing with Andrew's Pitchfork that I'm just learning...so the following are more questions than suggestions.
The basics of Pitchforks/MedianLines are not very tough, but one can also delve deeply into them if so inclined. I suggested the "Andrews Pitchfork (Median Line)" thread on ForexFactory as one source. (I don't know if links to that site are discouraged, but you can easily search and find it). The free site MedianLine - Classic Trading Techniques Energized - What's New is another.
If I understand it correctly...you define "resonance" as "lines which show multiple hits"...and those "hits" could be "close to or passes through a point on a line".
Those points are not necessarily a pivot point but would add weight (score) to the line if they are... Is this correct so far?
Yes.
Your median line example with the Andrew Pitchfork helps show this...but your original example showed lines as a "fan"...so I don't have any idea on how to start drawing the lines yet..or which set of trend lines I should use for the lines instead of drawing them.
The first chart in my first post had "fan lines", so to speak, but at the bottom of the same post is the same chart with the Andrews Pitchfork drawn... and the point of that is to show that the Andrews MedianLine ended up right on top of one of the most resonant fan lines. The pt3 of that fork could have been anticipated(!).
The fan lines were drawn just by starting from a good major pivot low, and then each line drawn up to some future medium pivot. Why pivots? Because I already know that pivots are going to score higher in my system, so it makes sense just to start with drawing a line to one of them, AND THEN... observe does that same line also interact with additional pivots (preferred) or with additional OHLC prices of individual bars. Line "e" was such a line.
So...until I fully understand your strategy further...In order to set up a "scoring system"...I have a few novice questions...
What is the basic criteria of how a line or fan is formed (start line drawing where/when/why?) and how to expand it? To turn it into an indicator or EA...drawing the lines and recording the "hits" needs to be more systematic and not just "visually obvious"... And someone would need to know how to draw the lines consistently before they can start giving the "hits' weights for scoring.
Some is discussed above. When drawn manually, I chose to draw lines as I described. However for an automatic method, there's little point to identifying specific lines in advance to score. Better to just define a range of interest, and score every possible line at some granularity -- say 0.1pip or larger -- that will calculate the score of each line, and highlight the ones that peak.
What pivot to start with? The Pitchfork threads might give some idea, but I prefer simply to use "major" degree pivots. The 3 pivots of the fork are all likely to be similar degree of pivots, but there is not much by way of rule. Almost always, the pivots alternate (high,low,high; or low,high,low), and usually these are either the price extremes, but occasionally pt2 is shifted to encompass more of the price action as if the pitchfork is a channel (or dual-channels). One can just experiment to gain insight and experience.
Once you have your lines drawn consistently...what criteria and reasons do you give "weights" to your "hits"...closeness, crossing, touching, multiple touches...or what and why?
And once you have your "scoring weights"....how is this criteria to be used to make your Buy/Sell strategy?
I want whatever "works" to score highest. And by "works", I mean that which helps identify counter-trend trades where one anticipates the pt3 of a Pitchfork. By manual observation, I've already seen that pivots (the bigger the better) are good criteria. I've seen that OHLC of bars seem to help, but the total of such must not overwhelm or dominate the score such that the pivots get lost in terms of importance. In other words, a line that passes through the middle of a zillion bars will touch a lot of OHLC prices, but it won't likely be nearly as powerful as other lines that interact with specific strong intermediate-pivots. Other criteria I've already noticed were mentioned previously, but... with a program in place, I would hope to make new observations and fine-tune the program accordingly.
My apologies if you have already answered these in your posts...but a quick checklist approach would be very helpful to get the strategy down to it's basics.
Yes, some of this was discussed, but hopefully clarified a bit more.
Hope this helps you stimulate your ideas...
RobertScore the resonance of a Trendline to Pivots, OHLC?
My responses are embedded below in blue:
Hi Kent,
Very helpful thanks.
Drawing line(s)... So instead of picking a major pivot in the past to start with...a line will be drawn between the pivots in a specific (date) range?
Still not sure if the lines will be pitchforks or fans or both...but both would work to score the hits.
Assigning weights for the hits...
From your examples it looks like you already have a good start on prioritizing your weigh values...and your descriptions were helpful in understanding how you might start scoring the hits...
Value Weights : Major pivots > intermediate pivots > OHLC touches... And you can now add the other criteria you discussed earlier.
Interesting strategy... I will be curious to see what results you come up with after more experimentation.
Good luck and have fun experimenting...!
Robert
- Free trading apps
- Over 8,000 signals for copying
- Economic news for exploring financial markets
You agree to website policy and terms of use
Hello expert MT4 programmers and users.
I've written a lot of MT4 indicators, some with even >25K lines, so I am in fact a serious programmer. However, I'm not so strong with code algorithms, and in particular, I am struggling with how to implement an idea to measure the resonance of a Trendline (actually any object with line(s) ) with respect to the way that it interacts with Price Action (PA) as it cuts through the bars. This measurement would result in a resonance "score" for a given placement of the object.
We've all seen lines that cut through price that serve as both Support and Resistance. The best "resonance" as I'm defining it would be if the line touches 1 or more pivots (especially >1), or whether it touches or comes close to one of the OHLC prices of each bar. If a bar cuts through a line but the next bar has a retest before continuing through, even though the line didn't hold, the retest should slightly increase the resonance score. If there are minor pivots that touch the line, these should obviously influence the score as well, and ideally, the larger the pivot (either by approach or departure or both), the higher would be the score compared to a smaller pivot.
Consider this AUDUSD,Daily chart.
I drew 5 lines through the chart, all starting from the same major pivot low at the left. The lines are selected, and the labels (a,b,c,d,e) are next to the pivots to where each line was drawn.
By quick observation, the bottom of 5 lines (e) would obviously have the best "score" for these 5 lines drawn.
For the bottom line "e", I circled in pink 5 areas of key close interaction to this line, and labeled each circle as 1 thru 5.
Casually glance now at the other 4 lines, a,b,c and d. By definition, every one of them interacts with at least 1 pivot because that's how I drew them. But you can see that few of these 4 lines have much more in the way of interactions. (The 4th line down, "d", does have several interactions, but no 2nd pivot; just lots of OHLC pass-throughs).
Back to the bottom red line "e"... You can see that 2 circles are at exact pivots (#2 is a low, #5 is a high). Circle #1 is almost a pivot, but not officially at that large red bar low, since price is lower a couple bars later. However, #1 also circles a green bar whose Close price is a perfect intercept. Then the large green bar has an Open very close to the line, then the 4th red bar is a retest that is possibly a pinbar too. These non-pivot interactions should slightly increase the score.
Circle #3 shows a nearby High for the bottom most green bar; the next green bar is a gap Open that is closest to the line.
Circle #4 is a large bar break that follows with a retest High. The retest is of most interest to me here.
You can see 2-3 other near approaches to this line that I didn't also circle, but they are maybe 6-10 pips away. Probably they can influence the score, but much less so because of their greater distance.
To implement this scoring idea, I'm thinking that every OHLC price would have to have some quantified weighting value. If the Trendline comes within some range of closeness to any of the OHLC prices, a fraction of the weighting would be added to the score, where the fraction is highest (1.0x) the closer the line is to the target, down to 0.0x as the line moves beyond some defined range from the target. If a line passes in between, say, the Low and Close price of a bar, one must not overly count the score of both interactions. Pick one and score it, or pick both, but be sure it's less of a total score compared to a perfect touch through the Low, for example.
While the absolute value of a "score" may be of some importance, it would also be important to either normalize the scores or at least to emphasize the peak scores within a narrow band of lines. (Given a cluster, which one(s) stand out). One line might cut through very few bars but it could have an absolutely powerful S/R test on it that makes for a strong line, whereas another line might cut and chop through a large number of bars, and while the line does interact with a lot of OHLC prices as a result, the line doesn't actually have much to distinguish it from other nearby lines, and it certainly doesn't deserve greater consideration than the other line with a single but powerful reaction.
The above is a lot of details, but it doesn't tell why this is of any interest.
Well one reason is this... a line that has started to have noticeable and decent resonance will often have future retests of the line which are trade-able touches. In my example, I circled 5 resonances on line "e", but had one observed the first 4, the 5th could well have been anticipated and traded short! (483pips!).
Of even greater interest to me is the fact that the MedianLines of Andrews Pitchforks very often have decent "intra-fork" resonance that occurs at the very moment that the 3rd pitchfork pivot forms. In other words, one can anticipate where the 3rd pivot may form, and watch, real-time, how price reacts at the ideal place of best resonance. It doesn't always happen that pt3 forms at such places, of course, but when it does, the reward:risk can be excellent.
Look how this Andrews Pitchfork has its MedianLine exactly coincident to line "e"! The pt3 of the fork could be anticipated and traded with probably very low risk (10p? 25p?) but it has resulted in a 286p bounce so far!
This was not a mere coincidence. While these bounces don't always happen as perfectly as this one, they do happen frequently enough, and can very well be automated as an EA. (Experienced traders should recognize that I'm just using the Pitchfork to draw a Centerline/Action/Reaction set of lines, and I'm watching the Reaction line for a trade-able opportunity. But not discussed here are the additional opportunities to trade the normal post-fork resonance which may occur in the future, well after pt3; that's another topic for later).
But the ability to properly "score" the resonance of the line(s) is critical, and this is the piece of coding that I'm struggling with at present.
The scoring must be done efficiently, to identify with one pass (per new bar, perhaps) what are the key lines with high resonance scores. The program must assign weighting values to every OHLC. How much weight to assign is a big task. Then it must make a one-pass calculation of a very large number of possible Trendlines to discover which few are of key interest/high score. And then these lines will be interpreted to identify key resonant prices to watch for at the current Bar[0]. If price begins to react to a target, as observed on an M1 chart, for example, a quick decision can be made when price is still very close to the target, when the risk (stop-loss) is lowest, and the possible reward for the anticipated counter-trend move occurs (or not).
How close a line is to a past OHLC bar price may well need to take into effect how close it is to the 1st point of origin of the trendline. The closer, the less effect, perhaps, or at least, the closer must be the accuracy. One can imagine that soon after the left major pivot has form, there could be a retest, and while this retest should be part of the line score, a mere 0.1p difference can drastically affect the line slope if it's close to the major pivot, whereas if it's way far away, 0.1p difference has very little effect on the slope. The concept is hard to describe but if one thinks about it as much as I have, it becomes clearer that it must be considered.
I'm toying with the idea that I might need a dual score, one that separates the score into a Support score, and a Resistance score. (This could be tricky to interpret, I know). The distinction might be useful with respect to trading the actual line itself.
Since a key part of this method is related to pivots, I'd welcome tips about what kind of code is best to identify both minor and major pivots. (Zigzag is just a start, but I can imagine something much better; I just haven't found or written it yet, alas).
Can part of this be written as an indicator (or two)? Or must it be an EA that loops less often, to avoid overwhelming MT4 with redundant calculations every tick. (Ultimately an automated trading EA is the final goal).
Can you expand of the types of line interactions you think should influence the resonance score?
I welcome ideas for how I could go about coding this up (or perhaps we can collaborate; serious programmers only; send me a PM). Is anyone aware of other programs that have taken on this difficult (to me) task of scoring resonance? I welcome such code examples.
Thanks in advance for considering my request.
Kent (pips4life)