Suggest best way to write MT4 Confluence-of-targets EA that watches how PA reacts
So how do you tell a good target from a bad one?
So how do you tell a good target from a bad one?
Some individual targets are just naturally stronger than others, like Pitchfork medianlines, upper & lower medianlines, and also the half-way points between (often referred to as "quartiles" but I myself prefer the term "midlines").
However, the point of this program is a 2-pronged approach. The first is to find confluence (agreement) where 2 or more pitchforks or other price methods line up with a tight trading range. The second is to actually observe how price reacts when it gets to the target. (This is probably the hardest for me to code because code must be objective, not subjective).
I don't know for sure whether a target will hold, but very often a target with confluence will at least bounce enough pips to make it worthwhile to trade it. One possible strategy would be to make a trade at a target, continue to watch PA react, gauge how right or wrong you appear to be initially, and if it overshoots by much, then if you do get back into profit, take 1/2 or more of the trade off with hopefully a modest profit that you then use to buy yourself a free trade for the remaining 1/2. Give the trade a bit of room but not a whole lot, since if it really blows through a target, chances are it's going a long way.
Check out the attached pictures. The first (more recent pitchfork) is quite impressive in terms of the potential for a great trading program. This is only one Andrews pitchfork (blue), plus its Modified Schiff (magenta). You can see where PA respected the midlines of each (or "quartiles" that some call them). Many targets bounce within 10 pips. The best ones were nearly exact. You'll see a couple of places with larger overshoots, like 40 pips or so. Even those go back into profit long enough to get out, or take 1/2 (or 2/3) off to buy a free trade. These swings are 100's of pips.
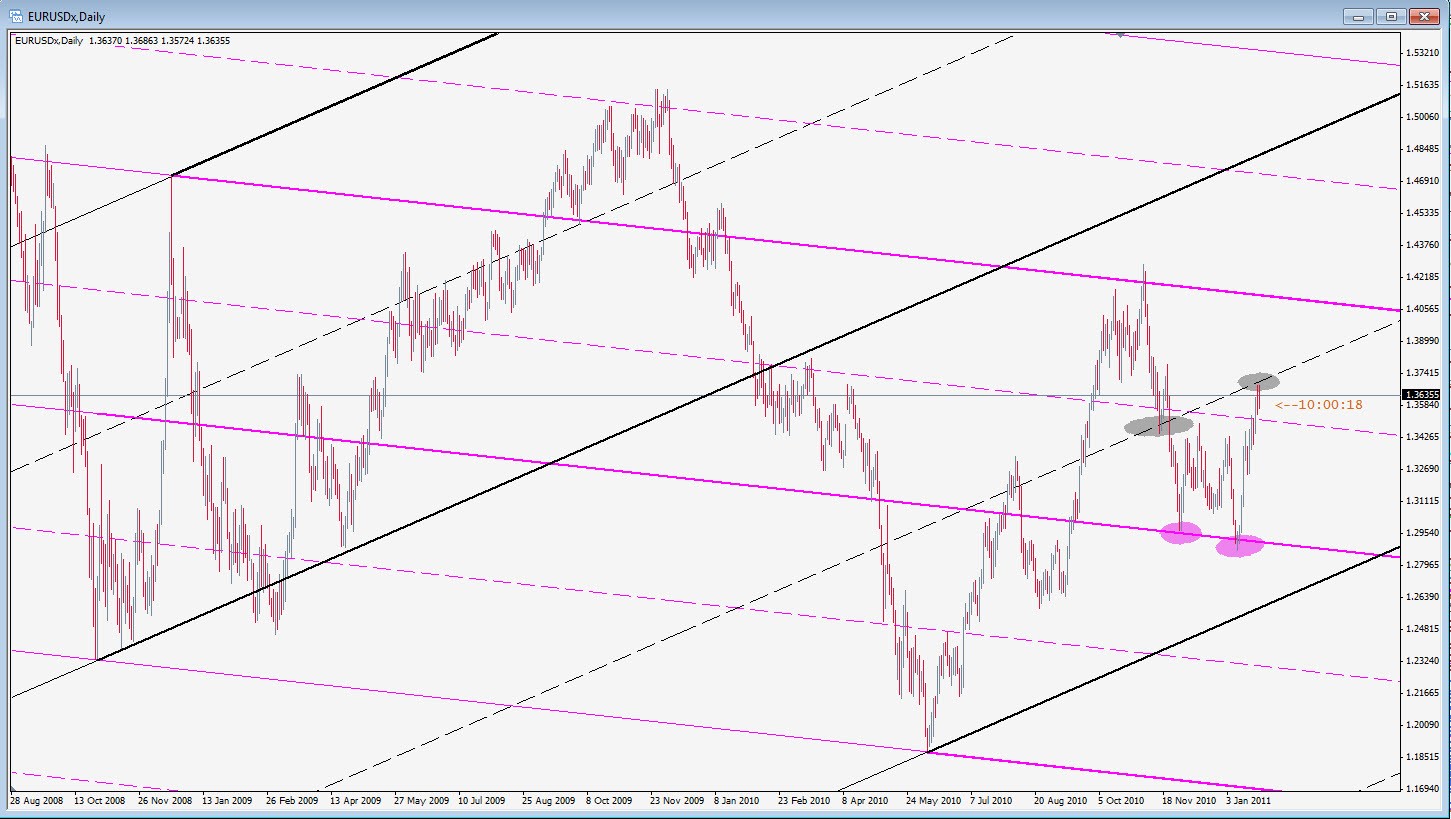
The second picture is an even longer timeframe pitchfork. I circled some areas that might have been considered together in confluence with the above pitchfork. You can see how the overshoots of one pitchfork often were just enough to exactly touch the other pitchfork. The confluence establishes, perhaps, how strong the target is and how wide in pips, so one can better estimate an entry and a reasonable stop-loss.
There are other pitchforks too, but no point in drawing them all. And of course, in many cases the targets don't hold, but where there is confluence AND when PA is observed to respect the target, I believe these represent good trading setups.
Suggestions how to code it? (I've begun the code to build the targets. I've not yet figured out how to analyze PA respecting the targets).
Thanks in advance.
Hi all,
I've written or modified several MT4 indicators & scripts but am a bit stuck on how to approach the writing of a rather complex EA I have in mind.
I'm looking for suggestions, and even better, some examples of other EA's that might do something similar to what I have in mind.
The idea is basically this: There are several TA techniques that present the trader with exact (but multiple) targets, but such targets may not be known to be good points of reversal (or acceleration) until after you see how PA reacts at (or nearby) that spot. There may also be several different methods that provide essentially the same target, or some very close value. If multiple targets agree with each other, this is called "confluence". If PA respects such points of confluence, at least for some amount of time, it may well be a good time to put on a trade.
The 2 key concepts here are confluenceand how price reacts. BOTH are of keen interest to me where I could use some coding suggestions.
What kind of confluence targets am I considering?
a) Properly drawn pitchforks are a key TA tool that offer several potential targets. The MedianLine, UpperML, LowerML are obvious sloped lines of interest. So are the "quartile" lines and some other key parallel lines (e.g. "Warning" lines). In addition to an Andrews pitchfork, there are many common transforms that can be calculated, such as the "Modified Schiff" pitchfork.
b) Key fibonacci ratios provide useful price targets that PA sometimes respects. Most of these targets are horizontal price lines (OBJ_FIBO, OBJ_EXPANSION), but they could also be sloped (FIBOCHANNEL) or even vertical Fibo TimeZone targets).
c) Key moving averages, e.g. 100 EMA and/or SMA. Others like the 50, 200, etc. Some MA's are better than others on certain timeframes. We all know that price sometimes bounces like a pingpong ball right off of a key MA; and we ALSO know that sometimes it blows right through. My hypothesis, however, is that if there is confluence (agreement) with several TA methods, AND if one observes that price is reacting at the target or narrow range, then a relatively low-risk opportunity exists for a short period of time -- while price is still nearby the target -- to place a trade with a stop just beyond the target.
d) Calculated targets such as various pivots.
e) Key S/R lines, however they are determined.
f) In addition to exact targets, one might also want to put in some filters based on various oscillators that perhaps must be in a certain condition in order to even consider a particular target. For example, if price has been climbing and is approaching some target zone, perhaps the zone is ONLY of interest if, say, RSI(14) is above 70 (in other words, in somewhat of an oversold condition). If the oscillator is setup for a reversal, perhaps it is just one more possible condition that adds to the "confluence" of what other TA methods suggest. Either approach is possible.
The details of each target method are not so important. Suffice to say that each can provide specific, multiple price targets for the current bar on the chart. What I need help with is what is the best way to organize (sort) the data such that an EA can compare the multiple targets to the current (and recent past) PA. Each target will have not only a price target but a weight-factor of importance. If several different measurements provide essential a narrow target-zone, this is great confluence and *might* make the target more interesting should PA approach and interact with it.
I'm thinking I should use 2-dimensional arrays but don't know the details of sorting such arrays.
How does one best measure how PA is reacting to a target?
i) One thing is certain: There could be tens or hundreds of "targets", but it would be a poorly written EA if it simply cycles through each and every target with every tick, looking for PA to react. Only the targets nearby to the current bar (OHLC) should be part of PA calculations.
ii) Given a target, obviously one must determine from which direction is price approaching the target, and for how long has price been on the same side of the target by looking at a few previous bars. This gets a little complicated for sloped targets (e.g. pitchforks, trendlines) where it is of interest whether a previous bar blew through a target zone, but for the current bar, is still interacting with the target.
iii) It seems reasonable to have some kind of time filter to avoid instant false alerts that a target has been hit and PA is respecting it. Suppose one is looking at (and running this EA on) an H1 chart. Before an alert is issued, perhaps an M5 bar must have come within X pips of the target, but has remained below for 1 (or more) complete M5 bars.
iv) Another reasonable measure is the velocity of price. How quickly did price approach the target, and how quickly is price now bouncing away from the target?
v) Is the target band "narrow"? Is it nearby several other targets (which makes it less important), or is it "far" away from other targets, and price is reacting well to it?
vi) The precision of how PA reacts is important. In addition, a weight-factor for each target must be part of the equation, and either one or more "scores" must be calculated that can be part of the EA's decision whether to take a trade or not.
Why am I thinking about this EA? Pitchforks are among my favorite tools, and yet it can be difficult to manually track several different PF's drawn from the perspective of different timeframes. About a week ago, the EURUSD bounced off of a high that I was able to see -- after the fact unfortunately -- that a long-term (2 year) pitchfork provided an obvious target and PA did in fact respect it. In fact, the vertical half-pitch (Upper-ML to ML) of the pitchfork is almost 1400 pips, and PA rose up to this target to within 2 pips, and then proceeded to drop like a rock to over 550 pips! It reversed again at another obvious PF target which it initially overshot by 10 pips on Sunday's opening bar, but then double-tested the target within 2 pips before rising 650 pips (so far!). The thing is there were also some other shorter-TF pitchforks that offered the same (or within 10-15 pips) target. An EA could easily have spotted this setup and taken a very reasonable R/R trade that in this case -- as in many others -- could result in a very large profit.
Just so you know, I do contribute to the FX community, but do so mainly on the FF forum. But I think this forum has a lot more experienced programmers and that's the help I need.
As an exchange, feel free to explore some of the useful indicators I've posted which are mentioned here.
Thanks in advance for any help & suggestions.
Kent (pips4life)
Yes all these are good ideas but putting them into one logic seems to be the challenge. I'd say u've got the right tools/levels in theory. If you ever implement such an EA do give me a shout,ill be first one to test ;)
- Free trading apps
- Over 8,000 signals for copying
- Economic news for exploring financial markets
You agree to website policy and terms of use
Hi all,
I've written or modified several MT4 indicators & scripts but am a bit stuck on how to approach the writing of a rather complex EA I have in mind.
I'm looking for suggestions, and even better, some examples of other EA's that might do something similar to what I have in mind.
The idea is basically this: There are several TA techniques that present the trader with exact (but multiple) targets, but such targets may not be known to be good points of reversal (or acceleration) until after you see how PA reacts at (or nearby) that spot. There may also be several different methods that provide essentially the same target, or some very close value. If multiple targets agree with each other, this is called "confluence". If PA respects such points of confluence, at least for some amount of time, it may well be a good time to put on a trade.
The 2 key concepts here are confluenceand how price reacts. BOTH are of keen interest to me where I could use some coding suggestions.
What kind of confluence targets am I considering?
a) Properly drawn pitchforks are a key TA tool that offer several potential targets. The MedianLine, UpperML, LowerML are obvious sloped lines of interest. So are the "quartile" lines and some other key parallel lines (e.g. "Warning" lines). In addition to an Andrews pitchfork, there are many common transforms that can be calculated, such as the "Modified Schiff" pitchfork.
b) Key fibonacci ratios provide useful price targets that PA sometimes respects. Most of these targets are horizontal price lines (OBJ_FIBO, OBJ_EXPANSION), but they could also be sloped (FIBOCHANNEL) or even vertical Fibo TimeZone targets).
c) Key moving averages, e.g. 100 EMA and/or SMA. Others like the 50, 200, etc. Some MA's are better than others on certain timeframes. We all know that price sometimes bounces like a pingpong ball right off of a key MA; and we ALSO know that sometimes it blows right through. My hypothesis, however, is that if there is confluence (agreement) with several TA methods, AND if one observes that price is reacting at the target or narrow range, then a relatively low-risk opportunity exists for a short period of time -- while price is still nearby the target -- to place a trade with a stop just beyond the target.
d) Calculated targets such as various pivots.
e) Key S/R lines, however they are determined.
f) In addition to exact targets, one might also want to put in some filters based on various oscillators that perhaps must be in a certain condition in order to even consider a particular target. For example, if price has been climbing and is approaching some target zone, perhaps the zone is ONLY of interest if, say, RSI(14) is above 70 (in other words, in somewhat of an oversold condition). If the oscillator is setup for a reversal, perhaps it is just one more possible condition that adds to the "confluence" of what other TA methods suggest. Either approach is possible.
The details of each target method are not so important. Suffice to say that each can provide specific, multiple price targets for the current bar on the chart. What I need help with is what is the best way to organize (sort) the data such that an EA can compare the multiple targets to the current (and recent past) PA. Each target will have not only a price target but a weight-factor of importance. If several different measurements provide essential a narrow target-zone, this is great confluence and *might* make the target more interesting should PA approach and interact with it.
I'm thinking I should use 2-dimensional arrays but don't know the details of sorting such arrays.
How does one best measure how PA is reacting to a target?
i) One thing is certain: There could be tens or hundreds of "targets", but it would be a poorly written EA if it simply cycles through each and every target with every tick, looking for PA to react. Only the targets nearby to the current bar (OHLC) should be part of PA calculations.
ii) Given a target, obviously one must determine from which direction is price approaching the target, and for how long has price been on the same side of the target by looking at a few previous bars. This gets a little complicated for sloped targets (e.g. pitchforks, trendlines) where it is of interest whether a previous bar blew through a target zone, but for the current bar, is still interacting with the target.
iii) It seems reasonable to have some kind of time filter to avoid instant false alerts that a target has been hit and PA is respecting it. Suppose one is looking at (and running this EA on) an H1 chart. Before an alert is issued, perhaps an M5 bar must have come within X pips of the target, but has remained below for 1 (or more) complete M5 bars.
iv) Another reasonable measure is the velocity of price. How quickly did price approach the target, and how quickly is price now bouncing away from the target?
v) Is the target band "narrow"? Is it nearby several other targets (which makes it less important), or is it "far" away from other targets, and price is reacting well to it?
vi) The precision of how PA reacts is important. In addition, a weight-factor for each target must be part of the equation, and either one or more "scores" must be calculated that can be part of the EA's decision whether to take a trade or not.
Why am I thinking about this EA? Pitchforks are among my favorite tools, and yet it can be difficult to manually track several different PF's drawn from the perspective of different timeframes. About a week ago, the EURUSD bounced off of a high that I was able to see -- after the fact unfortunately -- that a long-term (2 year) pitchfork provided an obvious target and PA did in fact respect it. In fact, the vertical half-pitch (Upper-ML to ML) of the pitchfork is almost 1400 pips, and PA rose up to this target to within 2 pips, and then proceeded to drop like a rock to over 550 pips! It reversed again at another obvious PF target which it initially overshot by 10 pips on Sunday's opening bar, but then double-tested the target within 2 pips before rising 650 pips (so far!). The thing is there were also some other shorter-TF pitchforks that offered the same (or within 10-15 pips) target. An EA could easily have spotted this setup and taken a very reasonable R/R trade that in this case -- as in many others -- could result in a very large profit.
Just so you know, I do contribute to the FX community, but do so mainly on the FF forum. But I think this forum has a lot more experienced programmers and that's the help I need.
As an exchange, feel free to explore some of the useful indicators I've posted which are mentioned here.
Thanks in advance for any help & suggestions.
Kent (pips4life)