Secret Trading Tips
Trading Tip #16: Buyers or Sellers
A question I often receive is, "How can there be more buyers or sellers at one price? Isn't there a buyer for every seller and a seller for every buyer?"
The answer is yes, but people are forgetting one important thing. There is a bid and an ask (or offer), and only one of them can be traded at a time.
A bid is an expression of willingness to buy at a price; an ask (or offer) is an expression to sell.
If the ES is trading at 1200.50, the bid is either 1200.25 or 1200.50. The answer depends on which way the market has just traded. Let's make it easy and simply say the ES is between 1200.25 & 1200.50, making the bid 1200.25. In order for the market to move from 1200.25 to 1200.50, someone must pay up to get filled.
You may not be in a hurry and attempt to wait to buy 1200.25, but that will usually only happen when the bid/ask drops to 1200.00 & 1200.25 and you are actually filled on the ask.
If you are trying to buy and really want to get filled, you must pay up at the offer or risk missing the trade. Conversely, if you really want to get filled on a sale, you must hit the bid, or reach down to get filled.
Sure, there is someone on the other side of the trade, but without you choosing to reach up and pay the offer the market stands still. Therefore when trades are executed at the offer it is said to be done by the buyers even though there are sellers at that price taking the other side.
Every buy will be filled on the offer and every sell will be filled on the bid, period.
Let's say we once more have a number of 1200.50 and we see that over time (sometimes just a few seconds) the fills were 100 x 1300. We can say that there were 1200 more buyers than sellers at 1200.50 because of how traders reacted to the bid/ask spread when it was at 1200.25 x 1200.50 and higher at 1200.50 x 1200.75 (called the spread.)
When the market was at the lower spread, 1300 buyers reached UP to pay the 1200.50 offer.
When the market was at the higher spread, 100 sellers reach DOWN to sell the 1200.50 bid.
When the spread traded around this price range there truly were more buyers than sellers at 1200.50.
Understanding bid and ask can open up other realms of technical analysis.
There are some traders who will look at the bid and ask order flows to try to get clues to potential movement in the market based on what buyers and sellers are doing. This is often referred to as reading order book flow or depth-of-market.
If you look at the number of orders for each bid and ask around the current market price you can see the probable number of transactions available at those levels. Reading this information is the key to certain kinds of volume based trading systems and other trading methods that follow the book order flow.
Best Trades to You,
Larry Levin
Founder & President - Trading Advantage
Quote "There are some traders who will look at the bid and ask order flows to try to get clues to potential movement in the market based on what buyers and sellers are doing. This is often referred to as reading order book flow or depth-of-market.
If you look at the number of orders for each bid and ask around the current market price you can see the probable number of transactions available at those levels. Reading this information is the key to certain kinds of volume based trading systems and other trading methods that follow the book order flow. "
This wouldn't apply to retail traders unless you work in an investment bank.
The need to know this information is not really of any importance to enable to trade successfully.
Sir may I ask a question. does take profit and market order the the same? how about stop order and stop loss? If not could you explain what's the difference between them? Thank you.
Secret Trading Tip: What is day trading?
Day trading is probably one of the most misunderstood labels in the industry. Some people might picture a random trader acting like a cowboy just buying and selling with pure abandon. Others might imagine a seasoned vet pouring over charts and analysis, looking for a chance to try to scoop up a few points here or there. Let’s set the record straight on what day trading does – and doesn’t – entail.
Day trading is definitely not for the faint of heart.
Day trading is possible because of the great amount of leverage there is in the markets. The ability to buy or sell contracts that represent exponentially greater values than what is held in deposit in a trading account can mean the chance for big gains or even bigger losses. That is why a lot of day trading is thought of as gambling or a Wild West show.
There are a lot of traders out there who exclusively day-trade.
The mechanics to day trading are straightforward. You are in a trade and out of it in the same trading session. There is no “holding” the position overnight or through to the next session, looking for more potential profits. That is position trading. Why open a trading position and close it in the same session? There are a bunch of reasons that someone might cite, but the most obvious is that there is a different kind of exposure between trading sessions.
For a day trader, there is an inherent risk that the market may gap up or down and against an open position when trading begins in a new session. Picture some of the overnight or over the weekend financial bombshells that could be dropped. A couple of good examples are those nights when Asian markets have tumbled on their fundamentals and North American markets open much, much lower the next day. This would be a gap to the downside that would be a big negative to an open long position.
Closing things out before the session ends is a way that some traders try to avoid that kind of exposure.
So how do day trades work?
Most markets are a constant flux between buy orders and sell orders, and it is unlikely that a highly liquid market (one that has many buyers and sellers, making it relatively fluid to open and close positions) would stay at a constant price through a whole session. Day traders look to buy low, sell high and scoop up a few points to their benefit.
Trades can be based on:
- Identifying and trying to follow a trend
- Looking for technical signals that suggest a coming reversal and try to play a breakout
- Playing market movement off identified support or resistance
- Quick in-and-out trading strategies like scalping, where the trader tries to identify arbitrage opportunities where there is a price imbalance
- Any personal system a trader might use to try to identify trade opportunities
The last one on this list is becoming more common as trading moves into the electronic world. Programs on computers look for specific algorithms and other identifiers that may signal price action that a day trader can use to try to gain an advantage.
The one thing that people need to remember is that this style of trading can also quickly accumulate fees and commissions for each round-turn on a trade. Since you are not approaching the market with a single buy-and-hold approach, you have to factor these extra costs into the 2-3 points you are trying to gain on every trade. Make sure that there is enough room to make the risk-to-reward ratio worthwhile.
Day trading is fast, and risky, and not for everyone.
The quick pull-the-trigger style trading that is synonymous with day trading is not for everyone. There are great disadvantages and heavy risks. I think the big trick is to find and stick to a trading plan. Having a pre-determined approach to the market – a place to get in and a place to get out for profit OR for loss – should help you keep your head on straight. Trading with a plan instead of raw emotions is what separates the cocky cowboy image most people might have from the actual serious day trading reality.
Best Trades to you,
__________
Larry Levin
Founder & President - Trading Advantage
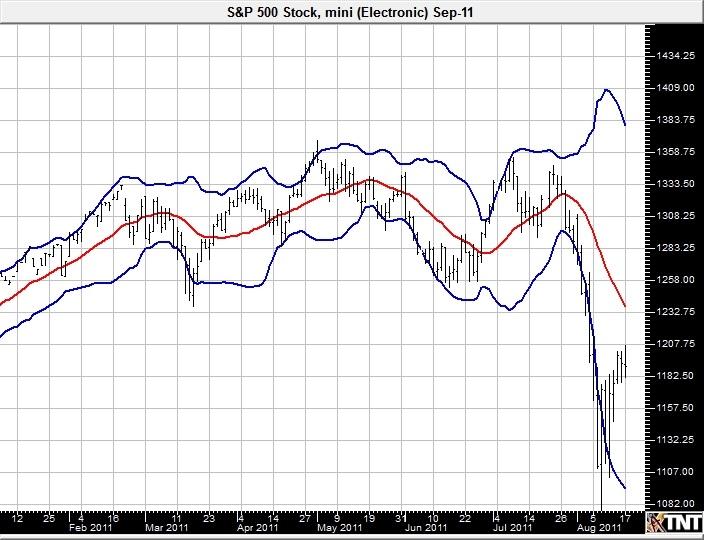
Trading Tip #30: Advanced Technical Indicators - Bollinger Bands
Let's take another look at a more advanced technical tool - Bollinger Bands. These were developed by John Bollinger in the 1980s. In simple terms, they use a simple moving average and standard deviations to give a different perspective on potential highs and lows.
Bollinger Bands have a middle band and two outer bands.
The middle band shown on this indicator is a moving average, usually a simple moving average (see Tip #29 for more on those) although some traders do use the exponential moving averages. The standard deviation formulas for the outside bands might be calculated like this example:
* Middle Band = 20-day simple moving average (SMA)
* Upper Band = 20-day SMA + (20-day standard deviation of price x 2)
* Lower Band = 20-day SMA - (20-day standard deviation of price x 2)
The actual values used may depend on user preference. Use and interpretation may also vary.
This technical tool is a way some traders try to define and observe potential patterns. I don't claim to be an expert on these, but there are some common basics that analysts agree on. Volatility is the name of the game for the upper and lower band. Since they are based on standard deviations from the middle band they move closer to the middle when volatility contracts, and further out when volatility expands. Based on this level of volatility, the relationship between those lines and prices can be used to signal potential market conditions. Some analysts might see an overbought market where prices touch the upper band. Conversely, an oversold market might exist when prices are edging towards the lower band.
Past performance is not necessarily indicative of future results.
courtesy of Barchart.comOther subtle patterns can be seen with Bollinger Bands on a chart.
The way the prices interact with the bands can lead to different kinds of patterns that technical analysts might interpret for trade designs. They have names like W-bottom or M-top or walking the bands. If you like playing with these statistical measures, you might enjoy reading more about them. Generally speaking, the visual cues regarding volatility are the main feature for this kind of chart overlay. They can also be used in conjunction with other analysis or observations as a way of complementing other signals or patterns. Play with Bollinger Bands and see how they might work with your trading tools to confirm or sharpen your market observations.
Best Trades to you,
Larry Levin
Founder & President - Trading Advantage
Let's take another look at a more advanced technical tool - Bollinger Bands. These were developed by John Bollinger in the 1980s. In simple terms, they use a simple moving average and standard deviations to give a different perspective on potential highs and lows.
Bollinger Bands have a middle band and two outer bands.
The middle band shown on this indicator is a moving average, usually a simple moving average (see Tip #29 for more on those) although some traders do use the exponential moving averages. The standard deviation formulas for the outside bands might be calculated like this example:
* Middle Band = 20-day simple moving average (SMA)
* Upper Band = 20-day SMA + (20-day standard deviation of price x 2)
* Lower Band = 20-day SMA - (20-day standard deviation of price x 2)
The actual values used may depend on user preference. Use and interpretation may also vary.
This technical tool is a way some traders try to define and observe potential patterns. I don't claim to be an expert on these, but there are some common basics that analysts agree on. Volatility is the name of the game for the upper and lower band. Since they are based on standard deviations from the middle band they move closer to the middle when volatility contracts, and further out when volatility expands. Based on this level of volatility, the relationship between those lines and prices can be used to signal potential market conditions. Some analysts might see an overbought market where prices touch the upper band. Conversely, an oversold market might exist when prices are edging towards the lower band.
Past performance is not necessarily indicative of future results.
courtesy of Barchart.comOther subtle patterns can be seen with Bollinger Bands on a chart.
The way the prices interact with the bands can lead to different kinds of patterns that technical analysts might interpret for trade designs. They have names like W-bottom or M-top or walking the bands. If you like playing with these statistical measures, you might enjoy reading more about them. Generally speaking, the visual cues regarding volatility are the main feature for this kind of chart overlay. They can also be used in conjunction with other analysis or observations as a way of complementing other signals or patterns. Play with Bollinger Bands and see how they might work with your trading tools to confirm or sharpen your market observations.
Best Trades to you,
Larry Levin
Founder & President - Trading Advantagegood tips, I also use Bollinger bands, I use upper and lowernya as boundary movement of prices when the price was in the bands
good tips, I also use Bollinger bands, I use upper and lowernya as boundary movement of prices when the price was in the bands
I agree, they are so usefull ...
Trading Tips: Five Ways to Stay Focused In Scary Markets
In the fallout from the 2008 global financial crisis, there have been moments that have been driven by pure fear. These are the moments when it can be hard to maintain your composure and trade your plan. Unfortunately, these big days are the times when you need that composure the most. Here is a quick lesson in why it is important to keep focused in a scary market and how to achieve that focus.
Market Basics
First let us understand some market basics. Markets exist to facilitate trade. From moment to moment the market offers traders the opportunity to profit from price movement. It's an environment where every trader has the freedom to create his own results, i.e. all the choices and the power to exercise those choices reside with the trader.
'Scary' implies fear, anxiety, or insecurity.
In his book, The Disciplined Trader, Mark Douglas addresses these issues in a no-nonsense, no holds barred way.
Let me give you an example of his views on this subject:
"It was only the lack of trust I had in myself to do what was needed to be done that I was really afraid of."
"The market is never wrong in what it does; it just is."
"The market cannot take anything away from you that you don't allow."
"In the trading environment the outcome of your decisions is immediate, and you are powerless to change anything except your mind. You have to learn to flow with the markets; you are either in harmony with them or you are not."
It becomes self evident that your trading success will be dependent on your ability to correctly perceive opportunity, to execute a trade arising from that perception and your ability to allow your profits to accumulate.
Are You Consumed by Fear?
Markets are inherently scary. If you are a trader consumed by fear, then the market will always be scary, and the only variable is how scary it is at any given time. When consumed by fear a trader is doomed to failure. Fear will twist your perceptions and blind you to the opportunities available. Fear will almost always drive us to make the wrong action, and it will without question make us totally incapable of accumulating profits that might be made. Even for disciplined and proven successful traders, the markets can be scary.
Objectively scary markets can be quantified by the Volatility index, the VIX - the ticker symbol for the Chicago Board Options Exchange (CBOE) Volatility Index. It is constructed using the implied volatilities of a wide range of S&P 500 index options. This volatility is meant to be forward looking and is calculated from both calls and puts. The VIX is a widely used measure of market risk and is often referred to as the "investor fear gauge." Levels below twenty are associated with market complacency and over thirty with increasing market anxiety. Extremes are often excellent contrarian indicators.
Trading should be considered a business, and your rules should reflect good business practices. These would include adequate capitalization. Conservation of capital is your primary job. If you are under-capitalized, you are half way to the losers stall before you even start.
Over-Trading & You
Do not over-trade. This too will drain your energy, your attention to detail, your perception of price changes and the efficiency of your trade execution. Over-trading will inevitably drain your capital from your account to the guy on the other side of your trades, who you can be sure does not have his/her perceptions blunted. If you have this as your guiding star, chances are you will eventually succeed in this business. Preserving capital is closely associated with risk management, and I will address this in the five things you can do when there is evidence of market anxiety.
5 Rules to Trade By
1) Stick to a Trading System that has proved itself over time to be profitable despite losing trades. No system is 100% correct. It only needs to be correct 50% of the time if profits are substantially greater than losses.
2) Never Anticipate Your System. Let your system fully play out so that its various criteria are fulfilled before entering your trade. When in doubt keep out or if already in a trade, get out!
3) Always Use Stops; NEVER trade without them. Make it your practice to enter your stop loss trade before you enter your trade.
4) Never Let a Winning Trade Become a Losing Trade; use a trailing stop once your trade is showing a profit. Once a trade is showing a two-point profit, consider bringing in your stop to the entry price. Should the market unexpectedly reverse, it would be a scratch trade. After that, trail your stop two points for every two points prices move in your favor.
5) Trade with the Trend. Do not attempt to pick tops and bottoms to trade against the trend. Following these principles and spending the time necessary to create the psychological stability necessary to succeed is the most difficult part of this profession. Your goal should be to have the self knowledge and confidence that you unquestionably believe in your trades. Identify with Mark Douglas' dictum, "markets can't do anything to any trader who completely trusts himself to act appropriately, in his best interests, under all market conditions."
Best Trades to you,
_________
Larry Levin
Founder & President - Trading Advantage
My tips would be make a simple and timely research of the company. It is imperative that these research material be constantly updated and monitored so slight and even negligible movements can be pointed out and paid particular attention.
- Free trading apps
- Over 8,000 signals for copying
- Economic news for exploring financial markets
You agree to website policy and terms of use
The world of trading has many parts that seem a little foreign to new traders. There are plenty of catch phrases, symbols, and other banter that can be intimidating or even confusing at first. One of the biggest sources of confusion includes the shorthand that you see for many markets. Understanding what you are reading is important, and learning the basic lingo can come in handy.
Everything has a specified time and place
All futures contracts (be it for commodities or financial instruments) have very specific parts, quantities, and dates associated with them – and that’s before you even worry about the price! Not all contracts are created equal. The value of the S&P 500 contract is five times the value of the e-mini S&P 500 contract. Those are two symbols you wouldn’t want to confuse! If there are markets you want to trade, visit the exchange’s website and learn about the key parts for each contract. These will include:
The contract size
The futures months for the contract
The format for the price quote
The smallest amount by which the price of the contract can move (whole points or fractions of a point, also known as minimum tick)
Any daily trading limits for price movements
Trading symbols for the contract
- And much more!
Gimme an H! Gimme a U!
Memorizing all of this might seem like a bit of overkill, but in modern electronic markets making a mistake can happen in seconds and cost an unlimited amount of loss and confusion. Just remember that “fat finger” trade and the trouble it caused!
Let’s take a look at a contract I trade, the e-mini S&P 500. This futures market trades electronically (hence the “e”) on the CME Group’s Globex platform. On their website, I can go to Contract Specifications and learn that:
The symbol for this market is ES. I can use this code to find price quotes on many tickers.
The contract size is $50 x the e-mini S&P 500 futures price. I can use this value to calculate the dollar risk/gain per point in the market. Basically, if each point is worth $50, a 3 point movement would be $150. If I want to calculate the total dollar value of a single contract, I just have to multiply the current price by $50. If the market is trading at 1,280.00 that means it is worth 1280 x $50 = $64,000.
The minimum price fluctuation is 0.25. That means that if I am making an offer or trying to quote a price, I know that there are quarter point increments so I can’t offer a price like 1265.30 in this market. It would have to be 1265.25 or 1265.50.
The contract details also list the trading times so I know when a session begins and ends, and also the trading contract months. This market has contracts for March, June, September and December (the quarterly cycle) – these months will be written with their own symbols as well – H, M, U, Z. The full list of monthly symbols is:
JAN - F
FEB - G
MAR - H
APR - J
MAY - K
JUN - M
JUL - N
AUG - Q
SEP - U
OCT - V
NOV - X
DEC - Z
Each contract will expire at some point, and that date is relative to the contract month.
If you can understand the lingo, you can avoid costly mistakes
Some of this might seem like a no-brainer; after all, a lot of trading programs will give you the info with a single keystroke so you don’t have to memorize all of it. The reason I think it is still relevant to know this is because taking the time to learn and understand how the markets work and what the lingo means can save you potential trouble. What happens if you are long ESU11 and you try to close the position by selling ESZ11? Can’t do it – you would know that the ES U11 is the e-mini S&P 500 for September (U) 2011 and the ES Z11 is the e-mini S&P 500 for December (Z) 2011.
Best Trade To You,
Larry Levin
Founder & President- Trading Advantage