Sentiment zone oscillator ...
Sentiment zone oscillator ...
This version of sentiment zone oscillator replaces the fixed up and down levels with a variable ones. Instead of using fixed levels, it is finding the extremes in the last SZOLongPeriod bars and is using those extremes as a sort of dynamic up and down levels. In order to make them usable, the extremes are by default not set to 100% of the minimum and maximum but to 95% (that way they could be used for breakout detections)
PS: the author of the indicator originally uses it on ^DJI – Daily, so settings for forex symbols should be tested for and explored
mladen
May 2012 issue, How did you get it, I haven gotten my copy yet. And was at the news stand yesterday.
Keit
In the May 2012 issue of TASC, Walid Khalil in hid article "Exploiting Extremes Sentiment Zone Oscillator" describes a "Sentiment Zone oscillator"
 It is always ahead of the regular one
Sentiment zone 1.01
Noticed that some platforms added a moving average of the sentiment zone values as an additional information and I kind a liked the idea. So this is the version that has that moving average too
thank for share mladen, will take closer look for this indi
Adding buy and sell Rule to SZO
Noticed that some platforms added a moving average of the sentiment zone values as an additional information and I kind a liked the idea. So this is the version that has that moving average too
This look cool. It would be great if you can incorporate Buy/Sell trading rules (proposed by the author) for this indicator.
This version of sentiment zone oscillator replaces the fixed up and down levels with a variable ones. Instead of using fixed levels, it is finding the extremes in the last SZOLongPeriod bars and is using those extremes as a sort of dynamic up and down levels. In order to make them usable, the extremes are by default not set to 100% of the minimum and maximum but to 95% (that way they could be used for breakout detections)
PS: the author of the indicator originally uses it on ^DJI – Daily, so settings for forex symbols should be tested for and explored
Hi Mladen
Adding MTF
Thanks
Sentiment zone oscillator multi time frame ...
This is a Sentiment zone oscillator with multi time framing ability added (it is a standalone indicator, no need for any other indicator)
Hi Mladen
Adding MTF
Thanksjust got my S & C the old fastioned way by ..... Killing a tree !
mladen
Just got my SC magizine in paper back, I Took more interest in the story that came after the Semtiment Zone Oscillator story. There are a few major points I disagreed with that author about referance to Elliott Waves, Fibs, and his point of five as derived from Elliott Waves. I am a strong disbeleiver in these methods.
What I like were two things, A... It was the first time I've seen any one point to differeing chart time scales to derive the Fractal Demention of Price. Something I descovered years ago. and B... The other thing that really got my attention was his referance to Bill Dreiss and his Choppiness Index, although Bill actually used it in his risk Management and not as the author has indicated in this articale, that is if my memory severs me right. Also there was some test done by Active Trade Lab on the idex, sometime after he disclosed it, and it was not to be a good trading indicator as in buy and sell signals.
I donot remember which issue but Bill was interviewed by both Active Trader and Futures, on the same monthly issue of both maginizes. The Active Trader one was by far the better of the two. It would time me time to locate and to copy that interview if you like but its well worth any ones time to go back and read that interview over meny times, its the exact method of my tradeing. Although with the use of different indicators studies.
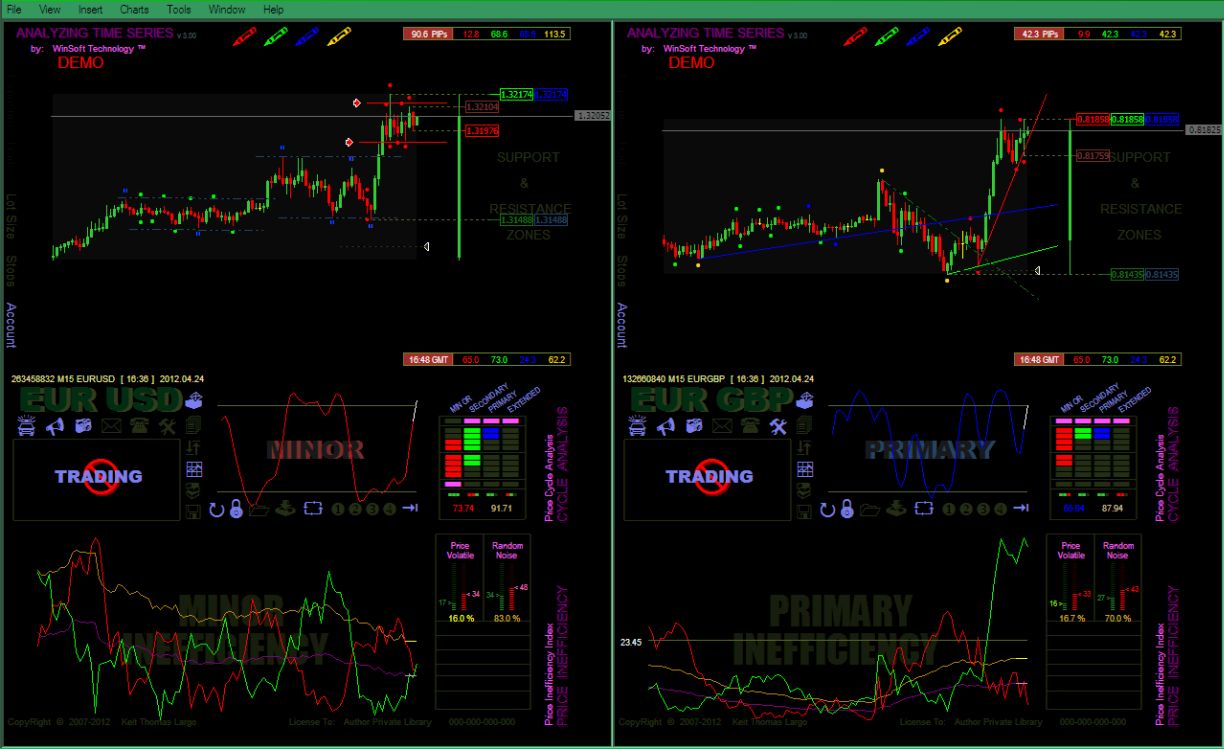
Now as for the Fractals, as mentioned in point A, I discovered meny years ago that one can actually find fractals real easy and determine there importance (levels), by looking at different chart time scales. Not in a factor of 5 but more like 3 or at the most 4. A lot of people has asked me (and I beleive that includes you) how do I paint the DOTs on the price charts that I use for drawning trend lines and Support and Ressitance Levels, (as well as exits). Well here you have it. My dots are in 4 different colors Red...Minor Green...Secondary Blue...Primary and Gold...Extended, all drown from the different chart time frames. The little chart in the middle of the trade client the one marked with either of the four dimentions noted are the means of determining the dot's locations. As for Bill Dreiss's Choppiness Index, well look and the bottom of the screen shot The Inefficiency Index. Looks some what like the ADX or some thing like a choppiness indicator? Will its my own creation it lets me know when price is NOT RANDOM, theres one for each of the 4 Fractal levels.
I dont have time to develope code out side of my customary form, but If you, that is, mladen whats to write it I will disclose the means that I draw the fractal dots, but not my inefficiency index, sorry.
Keit
Hello Keit,
i will sure like to read the interviews if you can find it and how you draw the fractal dots. maybe mladen or some other code writers can take it from there.
thank you for bringing it to our attentions.
best regards.
- zhao
mladen
Just got my SC magizine in paper back, I Took more interest in the story that came after the Semtiment Zone Oscillator story. There are a few major points I disagreed with that author about referance to Elliott Waves, Fibs, and his point of five as derived from Elliott Waves. I am a strong disbeleiver in these methods.
What I like were two things, A... It was the first time I've seen any one point to differeing chart time scales to derive the Fractal Demention of Price. Something I descovered years ago. and B... The other thing that really got my attention was his referance to Bill Dreiss and his Choppiness Index, although Bill actually used it in his risk Management and not as the author has indicated in this articale, that is if my memory severs me right. Also there was some test done by Active Trade Lab on the idex, sometime after he disclosed it, and it was not to be a good trading indicator as in buy and sell signals.
I donot remember which issue but Bill was interviewed by both Active Trader and Futures, on the same monthly issue of both maginizes. The Active Trader one was by far the better of the two. It would time me time to locate and to copy that interview if you like but its well worth any ones time to go back and read that interview over meny times, its the exact method of my tradeing. Although with the use of different indicators studies.
Now as for the Fractals, as mentioned in point A, I discovered meny years ago that one can actually find fractals real easy and determine there importance (levels), by looking at different chart time scales. Not in a factor of 5 but more like 3 or at the most 4. A lot of people has asked me (and I beleive that includes you) how do I paint the DOTs on the price charts that I use for drawning trend lines and Support and Ressitance Levels, (as well as exits). Well here you have it. My dots are in 4 different colors Red...Minor Green...Secondary Blue...Primary and Gold...Extended, all drown from the different chart time frames. The little chart in the middle of the trade client the one marked with either of the four dimentions noted are the means of determining the dot's locations. As for Bill Dreiss's Choppiness Index, well look and the bottom of the screen shot The Inefficiency Index. Looks some what like the ADX or some thing like a choppiness indicator? Will its my own creation it lets me know when price is NOT RANDOM, theres one for each of the 4 Fractal levels.
I dont have time to develope code out side of my customary form, but If you, that is, mladen whats to write it I will disclose the means that I draw the fractal dots, but not my inefficiency index, sorry.
Keit- Free trading apps
- Over 8,000 signals for copying
- Economic news for exploring financial markets
You agree to website policy and terms of use
In the May 2012 issue of TASC, Walid Khalil in hid article "Exploiting Extremes Sentiment Zone Oscillator" describes a "Sentiment Zone oscillator"
The sentiment zone oscillator (SZO) is a leading contrary oscillator that measures the extreme emotions of a single market or share.
It measures and defines both extremes, bullishness (overoptimism) and bearishness (overpessimism), that could lead to a change in sentiment, eventually changing the trend of the time frame under study.
The SZO was devised on the belief that after several waves of rising prices, investors begin to get bullish on the stock with increasing confidence since the price has been rising for some time. The SZO measures that bullishness/bearishness and marks overbought/oversold levels.In its basic implementation levels to look for are -7 and 7. In this version of indicator, compared to the original, what is added are adjustable levels (not the fixed -7 and +7)