Trading Using Price Action
I would agree with you that using the longer time frames is more accurate. It also limits your trades so you are not making as many decreasing the risk of losing more than you win. It is definitely easier to see the support and resistance as well as the trend in a longer time frame. I too use an SMA and EMA. I couple those with Bollinger bands which gives me plenty of information to work with.
The chart below is an example of what I like to use. You can see that it's very simple and easy to read.

Price action trading really is the best way to trade. I learned from Nial Fuller, he's got a lot of great free material that you can really learn a lot from. His course is definitely worth the small price too. It sure beats indicators and all the other junk out there. Pure price action baby!
To do price action trading do you have to use a tick chart? Also, what time frames are the best for it?
To do price action trading do you have to use a tick chart? Also, what time frames are the best for it?
No, I use a simple candlestick chart. The best time frame to learn on is the daily chart. I am mainly trading based off the daily and four chart time frames. Here is some more info on price action trading.
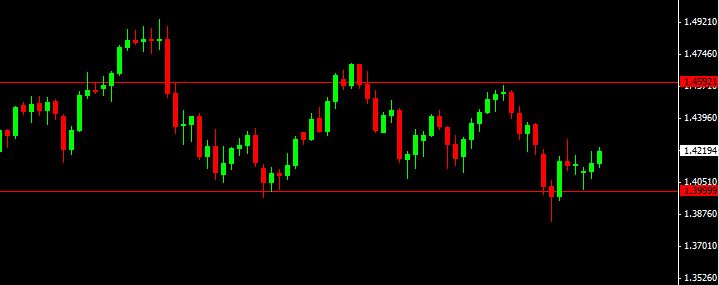
thank you for the information. Do you think that you could post a current chart showing support and resistance? I learn so much better visually and want to so see it on a real chart.
This is a chart show how the price retraced yesterday from the 50 SMA on the EURCAD and closed above it yesterday
Did you code in your support and resistance lines or is it built in your trade platform?
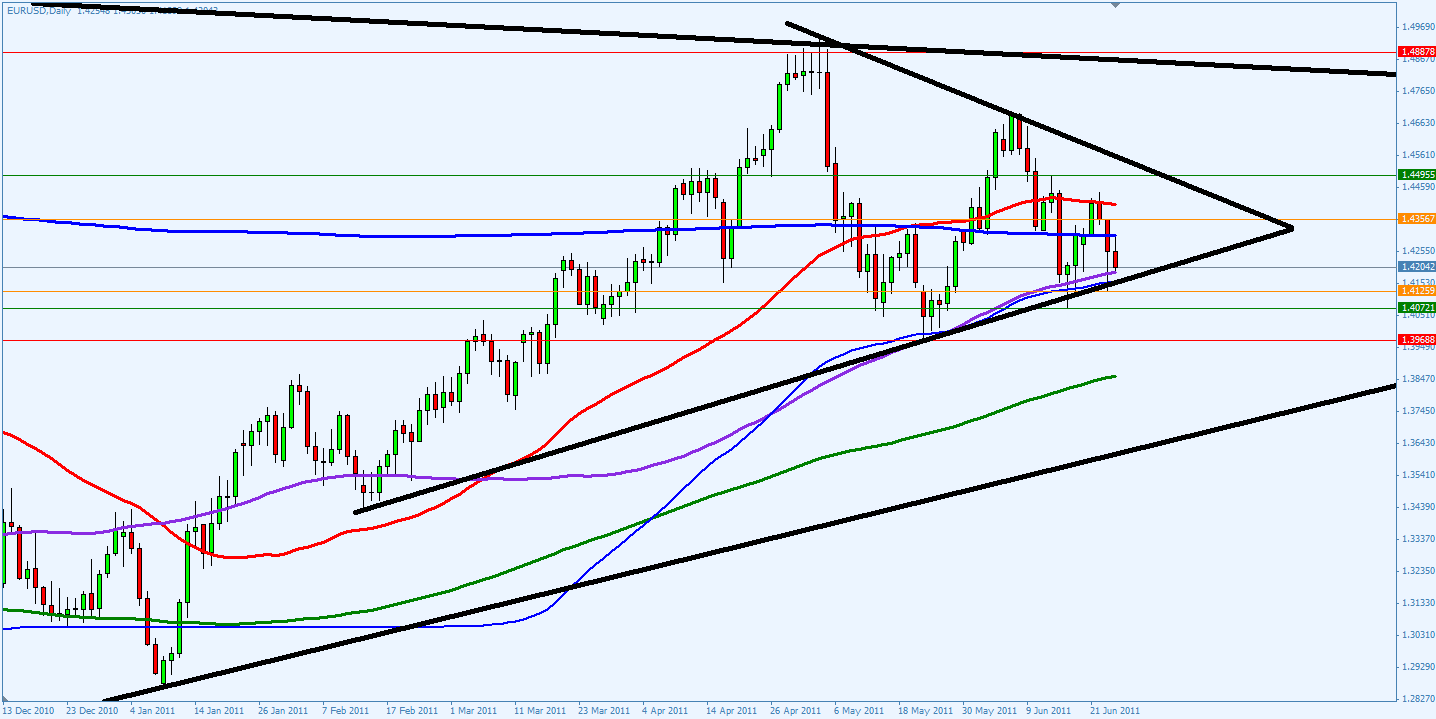
 Here's the current EURUSD daily chart...
if you look at the chart most likely direction will rise but at how we do the entry and exit?, and how to draw the line s / r?
if you look at the chart most likely direction will rise but at how we do the entry and exit?, and how to draw the line s / r?
You need to learn specific price action trading strategies...at least that 's how I enter....you can learn more about this here: price action trading.
As for support and resistance, check out this video on support and resistance.
- Free trading apps
- Over 8,000 signals for copying
- Economic news for exploring financial markets
You agree to website policy and terms of use
Hey everyone , i wanted to show you how that you can use price action to determine weather the price going up and down , through simple tools like Support & Resistance , Trend lines and Japanese Candle sticks
My story with forex started 4 years ago , when i started to trade smaller time frames like the 15 mins time frame , using the same price action im using now but with Stochastic , But now i realized that the bigger time frames are more accurate , and you dong have to set the hall day in front of the screen waiting for signal to come ......
Now i dont use Stochastic any more but i use the SMA 50 , 100 and 200 SMA , they are playing big role as support and resistance in the biger time frames starting from the daily chart
Some times the stop loss is bigger than the target but you can manage this through your risk .
Trading on the bigger time frames will give you clue what is happening in the small time frames too
So for example if you see an Inside bar and you should sell now in the smaller time frame and you know in the daily chart showing long patter you will never short it because you want to play it big
in the next days i will write here some signals and explanation how to use this system probably
if you want to check my history trading this system you can check my twitter account if the forum allow me to write it