Testing of systems of forecasting
neural-network, heuristic , fuzzy logic, all SOUNDS sophisticated
but need a huge DB to support
so I wonder , in a tiny program, whether they got a big array or very sophisticated caluculation to support it
but it is FUN to change the parameter and see what it will look like
--- good if you have to report to a boss (as long as you work in a brokerage firm)
Neksus, thanks for sharing it looks sophisticated.
Can you tell us how and where do you extract the files?The channel doesnt appear on my chart although I extracted the script file.Thanks.
welcome to compare PREDICTION (working ones pls)
-- may excahnge parameter input -- that make it work (on M5 time frame)
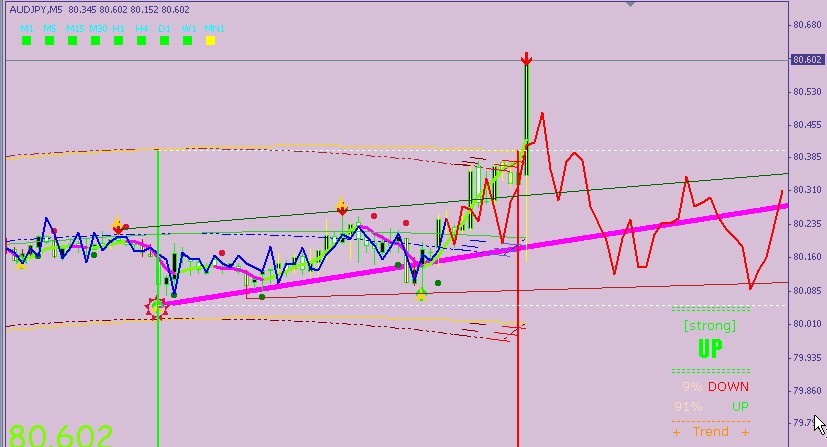
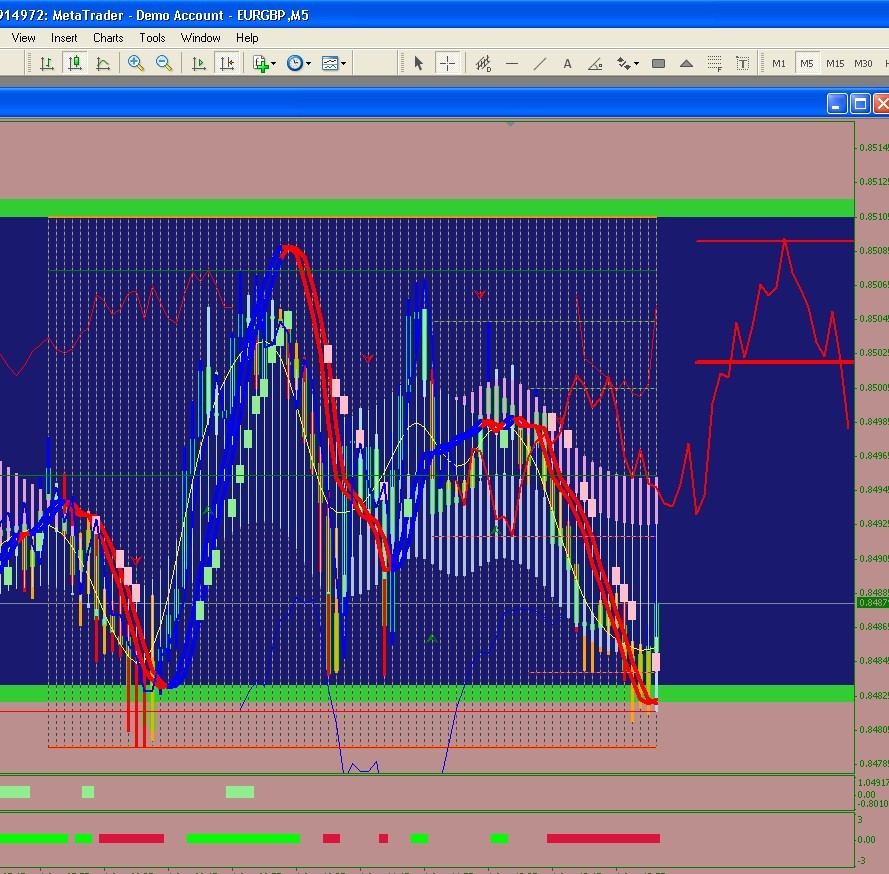
the dig --- what was predicted 20 min ago (blue are the training data , red is the prediction -- I use it with about 10 to 15 bar of the latest data -- to ensure CORRECTNESS of the system)
then I place a Future pending Limit Order ENTRY
and earn 11 pip (demo account)
====
rationale
-- the RED line is the prediction (with my setting)
it looks pretty close for about 5 to 8 bars
so I placed an ENTRY with a discount in buying
rather than 11pip, actually, it shoot to about 35 to 40 pip difference, just after I send up the LIMIT ORDER for 10 min
so this is a successful case
----
suggestion of usage
-- use different setting for different currency- so we could resue the SETTING and the template
-- when it is close
place future limit order
--- but use with other INDICAOTRS too (that must be agreeable-- as this is just a suggestion -- not reliable prediction for trends)
better than profit quick 10 pip or leave it open for about 30 pip, then pocket the 20 pip
--- it has to use with other INDICATOR or there is a GOOD EMOTIONAL value for this chart, -- as if the FUTURE trend is not as it predict, this will allow YOU to CUT loss FASTER and find some good point to CUT LOSS
precaution -- it is NO GOOD for early dawn aussie hours -- as the movement (tick chart) is far too slow
---- WELCOME to try the indicator -- I use only one (not ALL)of the enclosed indicator in this thread and on M5 chart, we could compare our result
still not sure whether -- it is a good ESTIMATION of future -- for this thread indicator-- but look interesting enough for US to TEST it out
or it got some mechanism to COPYCAT the current trend
blue line , are training chart (training bars)
red line , are FUTURE predicted trend -- note some RED LINE overlap last 10 bars or so (that tell the RED predicture is CLOSE approximation or FAR OFF from reality)
2 dig -- are about 2 hours apart -- red is the current prediction at that very moment -- NOTE: the currency moving quite steadily -- EUR/GBP pair
so far -- quite happy  with the testing
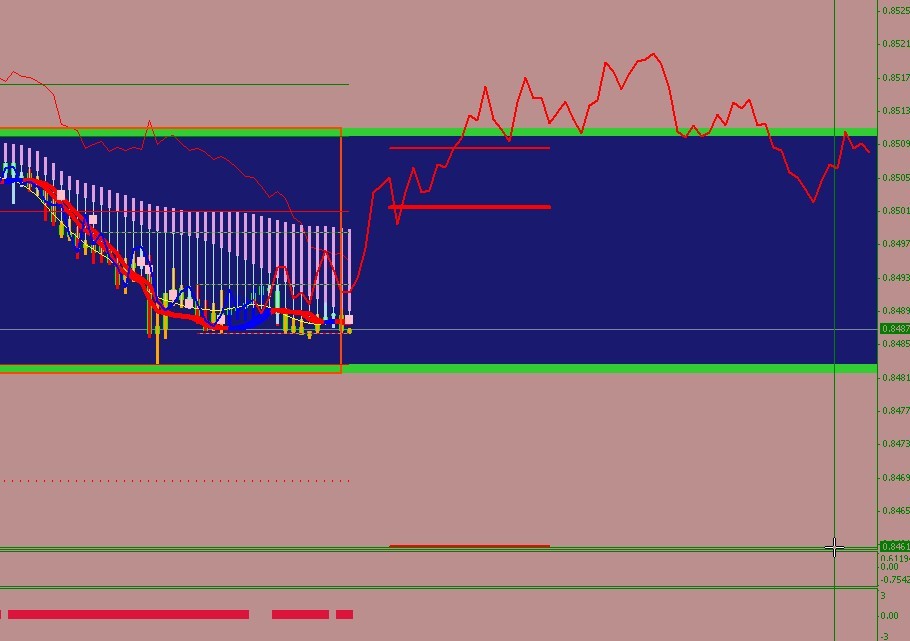
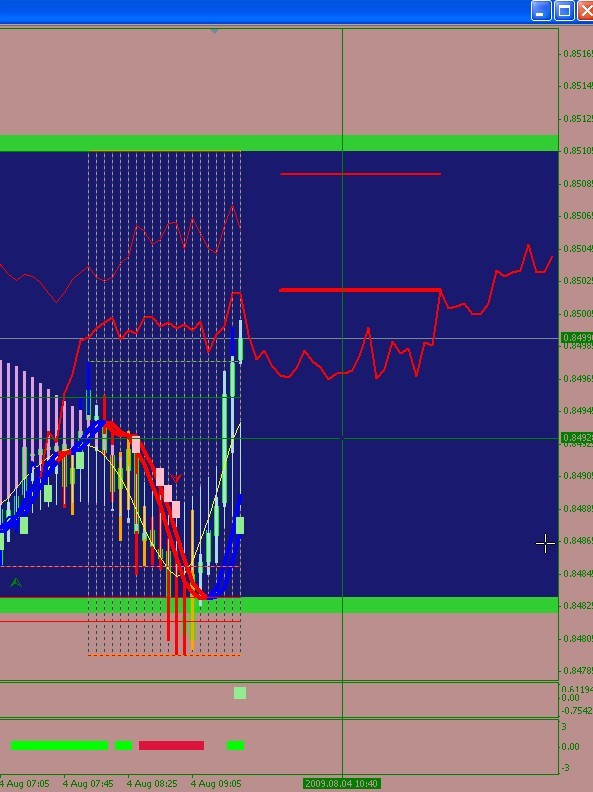
the RED LINE in the chart is always changing
picture above is M5 -- 0745 and 0800 (GMT)
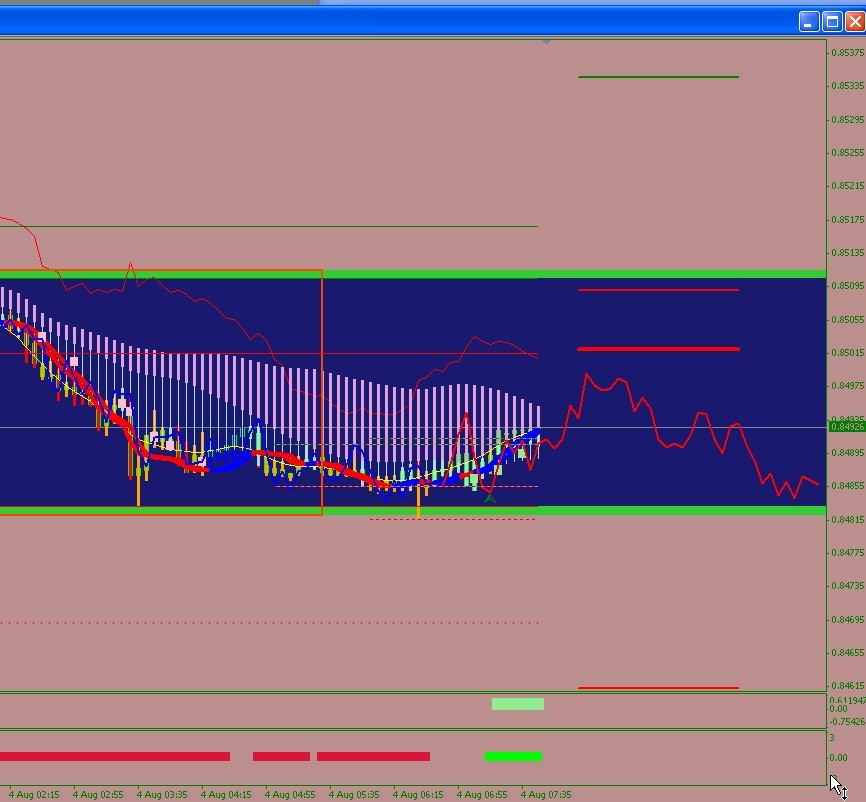
picture below is M5 is ====== 0800 and 0840 (GMT)
but it give YOU a perspective -- that you never think that it would go -- different from your mind set
this is GOOD because, what you BET on -or- what you pray for --- will not be correct Every-Single-Time (cut loss and admit that we make a mistake or suprise in the market -- is always difficult)
even the future the RED LINE in the chart i probably change in the next 30 min, but if you are holding a BAD ENTRY or it look like a consolidation zone -- then -- at least, give you visual that YOU SHOULD CLOSE IT !!!
this would help us STOP BREEDING
-- I learned datamining and Neural network before, when I see the MQ4 program, I don't think that it could be that simple (to do Neural network prediction) -- to draw or sketch the future
but it does have some LOGIC behind -- and I still don't know how it did that
I will KEEP ON POSTING my chart , you may want to evaluate THE INDICATOR called >> EXTRAPOLATOR
it is not PLUG-and-PLAY
you have to change the INPUT parameter, by pressing -i in your chart
welcome to put your JPG here -- may use snagit or screenhunter to get screen capture -- in JPG !!
we could compare with our picture --- and see how good / bad , the prediction are --- OVER HERE !!
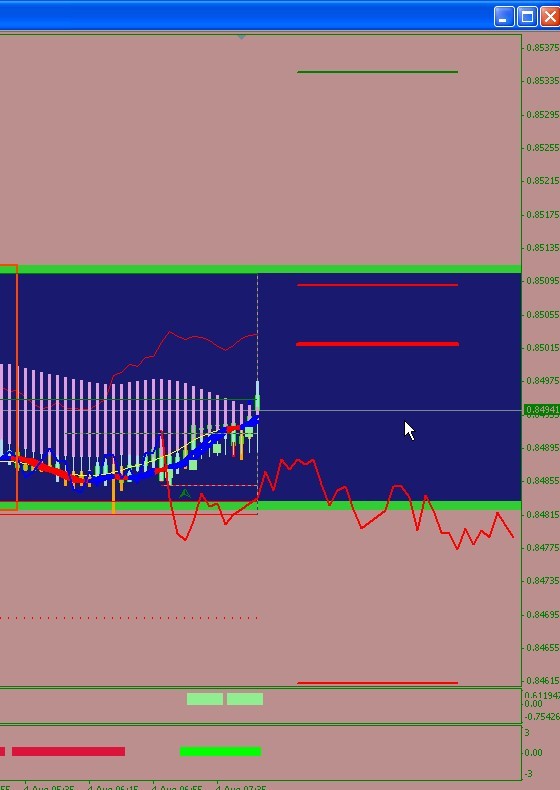
here is more picture (include one of the older picture)
there is a sudden Breakout in 5M chart, and somehow the software always connect one of the very last point , to make it LOOK better when it got the prediction -- even it is off for an hour bars or so
conclusion -- good tool for deteremining CUT LOSS and an alternative scenario of different type of trend - but can't based on all your decision on the PREDICTION and extrapolation
left picture is 0930 , picture on the right is many housr later it is 1420 GMT -- please note the price level -- that is more important , as it is not exact scale
hi
hi Neksus,
You can compare your NN with NN made by some member here ..hope find good and profitable NN indicator
===================
-- prediction -- will it be TURE for immediate future
Woow! It looks so dirty.

look at my screens
[nnea trend predictor] hheeh, don't know that this EX4 exist
it try to say , it either go flat or slightly DOWN
---
I welcome the idea of finding a good approximation EX4, mode 1 to mode 6
we could do it in MSN or PM here, I guess
I have not yet taking TIMELINE shots of the indicator performance, during FAST moving volatile period --- so would be delighted, if someone put up some snap shot (like those I put up for euro -gbp)
today, the currency would be QUIET or swinging, so I think the prediction should be doing so well, in this scenario
NN --- is just approximation, but if it can guess customer response rate in a MARKET at large, NN should able to guess what big bank professional TRADERS are doing !! --- so the program and formulae is a bit simple, using some MACD shape, but it could be promising and give us a DIFFERENT views (alternative views)
I hope that this could help in getting us to CUT LOSS or take profit -- if the prediction curve is good, it could helps for exit
[nnea trend predictor] hheeh, don't know that this EX4 exist
it try to say , it either go flat or slightly DOWN
---
I welcome the idea of finding a good approximation EX4, mode 1 to mode 6
we could do it in MSN or PM here, I guess
I have not yet taking TIMELINE shots of the indicator performance, during FAST moving volatile period --- so would be delighted, if someone put up some snap shot (like those I put up for euro -gbp)
today, the currency would be QUIET or swinging, so I think the prediction should be doing so well, in this scenario
NN --- is just approximation, but if it can guess customer response rate in a MARKET at large, NN should able to guess what big bank professional TRADERS are doing !! --- so the program and formulae is a bit simple, using some MACD shape, but it could be promising and give us a DIFFERENT views (alternative views)
I hope that this could help in getting us to CUT LOSS or take profit -- if the prediction curve is good, it could helps for exitTake a look at distribution of pending orders, and how they changes with time. It is not needed cutting edge algorithm to predict how distribution will change in nearest future.
here is more picture (include one of the older picture)
there is a sudden Breakout in 5M chart, and somehow the software always connect one of the very last point , to make it LOOK better when it got the prediction -- even it is off for an hour bars or so
Woow! It looks so dirty.
look at my screens
[nnea trend predictor]
- Free trading apps
- Over 8,000 signals for copying
- Economic news for exploring financial markets
You agree to website policy and terms of use
Kind time of days, at once I wish to ask a pardon for quality of messages, I do not speak English and consequently I write through on-line the translator.
So, in this thread I offer share with each other predicting индикатороми, shares and to test.
I spread everything that is:
Indicator Hologram
Research on the indicator
Indicator Extrapolator
The description:
At the heart of the indicator some methods which can get out entrance variable Method are necessary:
Method 1: Extrapolation of Fure of a number; frequencies are calculated using Quinn-Fernandes Algorithm
Method 2: Autocorrelation Method
Method 3: Weighted Burg Method
Method 4: Burg Method with Helme-Nikias weighting function
Method 5: Itakura-Saito (geometric) method
Method 6: Modified covariance method
Methods 2-6 are methods of a linear prediction (linear prediction). The linear prediction is based on a finding of the future values as linear functions of last values. We will admit there is a number of the prices x [0]. x [n-1] where more senior index corresponds to more recent prices. The prediction of the future price x [n] is as
x [n] =-Sum (a *x [n-i], i=1. p)
Where a - model factors, p - a model order. The listed methods 2-6 find factors a [] by reduction of a sredne-square-law error on training n-p last bars. Certainly it is possible to reach a zero error of a prediction on training bars if to solve the system of the linear equations resulted above directly at n=2*p a method of Levinsona-Durbina. Such method of a prediction is called Prony Method. Its lack is instability at a prediction of the future values of a number. Therefore атот the method is not included.
Other entrance data are:
LastBar - number of last bar in the last data
PastBars - quantity of last bars of future values used for a prediction
LPOrder - an order of linear model as fraction from quantity of last bars (0. 1)
FutBars - quantity of the future bars in a prediction
HarmNo - a maximum quantity of frequencies for the Method 1 (0 chooses all frequencies)
FreqTOL - an error of calculation of frequencies for the Method 1 (> 0.001 can not converge)
BurgWin - number of weighing function for the Method 2 (0=Rectangular 1=Hamming 2=Parabolic)
The indicator draws two lines: синия the line displays the prices of model for training bars, the red line displays the predicted future prices.
Examples
Method 1 (extrapolation of Fure of a number)
Method 3 (Berg's method)
Method 6 (Modified Covariance Method)
Extrapolator with Mover
"The image in attach"
It is the same indicator, as above only it works in a place with a script. Throw the indicator on chart, then a script, there is a channel which you set "template" for the forecast, in my opinion, quality of forecasting in this version of the indicator, on many above. Excuse, I have not found the exact description.
MACDmExtrapolation
"The image in attach"
Anything especial about this indicator I can not tell, it not especially is pleasant to me, somebody can will alter it.
Now, I will not spread two paid projects, these indicators as I very much respect the author of these workings out, I use these indicators and I wish to tell that they I am the best than those which have laid out, but всёже I have got used to other indicators and these two I use in the TS together with other predicting indicators.
The first project, it NNEA™ Neural Network Expert Advisors, on this site are created indicators and EA on the basis of a neural network. I use the indicator "Neural Network Trend Predictor", at this working out, quality of forecasting at the highest level
I have got the second project, which working out, is called "FX13 - the alternative technical analysis" it Extrapolator realised on system "Manhetton" if it is short, a principle of work such, the indicator does set of forecasts with different factors and when forecast lines pass the friend on the friend the forecast, very qualitative system of forecasting is formed if to use together Hologram, Trend Predictor and FX13, very qualitative forecasts turn out.
I hope that somebody will lay out still any predicting indicators, I wait for your opinion.
Yours faithfully NEKSUS