You are missing trading opportunities:
- Free trading apps
- Over 8,000 signals for copying
- Economic news for exploring financial markets
Registration
Log in
You agree to website policy and terms of use
If you do not have an account, please register
Also congrats to xard from me
@ andrewsvu i looked in all templates of xard but i don´t find this here :
Could anybody send me a link please
Not sharing!
Also congrats to xard from me
@ andrewsvu i looked in all templates of xard but i don´t find this here :

Could anybody send me a link pleaseNot included buddy, you can use XARD PUSH technology scripts. It works fine.
Some informations!
XARD's rules:
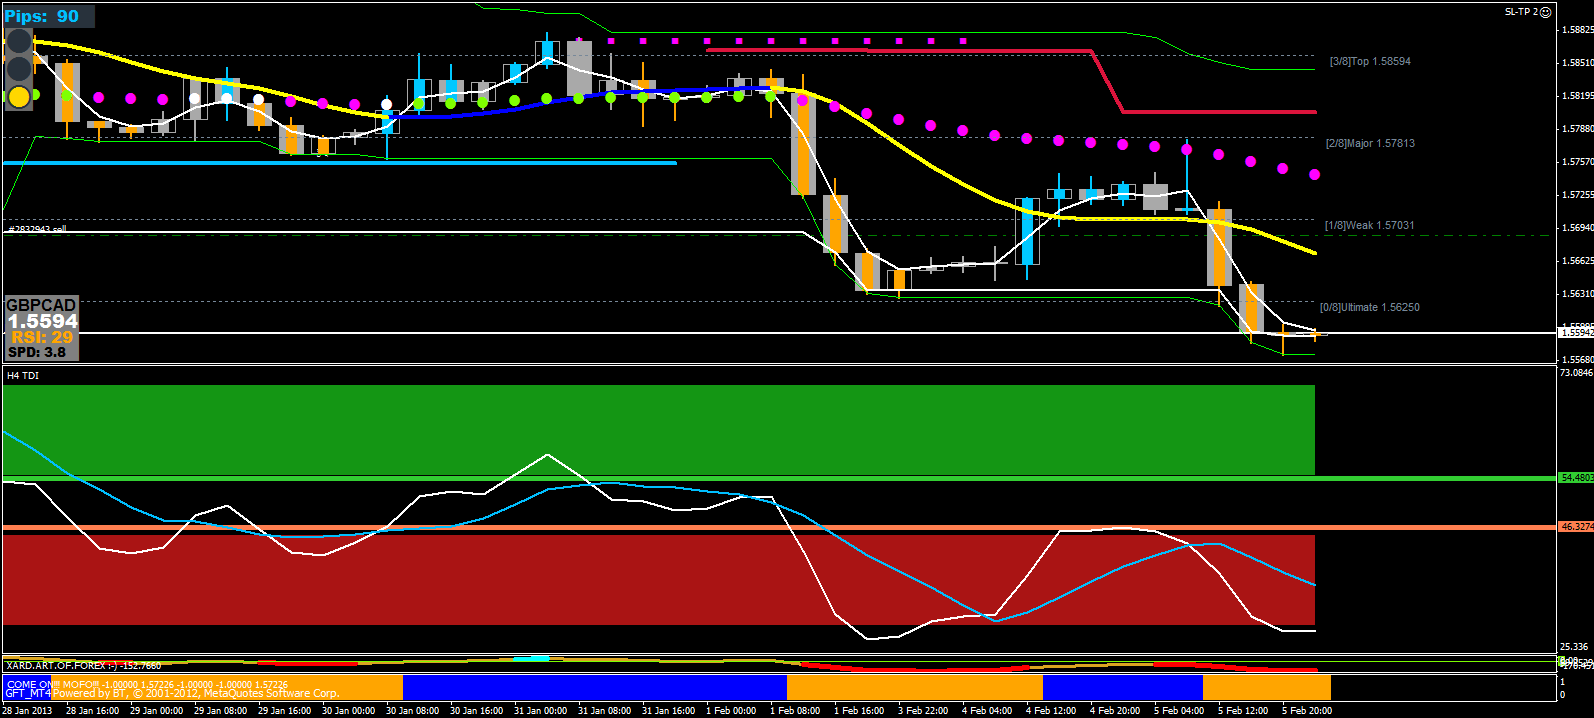
BUY: Signal-Line is above Trend-line and CANDLE is green.
Sell: opposite
If XARD system is met, check Maintrend color:
1. NAVY is BUY, and it means the trend potentially strong.
Before it turns NAVY, the steelblue color changed first. You might reconsider...
2. For Sell is apposite.
3. Confirm Powerfuse to be in blue dot and has cross the BB
Enter trade. If R/S is near, wait until price crossed the R/S or put pending order instead.
Note: Always check the daily if you want stay in-trend whether 4H and Daily are same direction. Especially the powerfuse indicator, If they are both same color, then you can take partial profits and let it run.
TakBir indicator I am using for S/R, I noticed the price somehow reacts to those lines, I attached here some translation how to use it.
These rules are my opinions, you can make and adjust for your own. I don't trade live yet, so if you do, don't blame me.
Thanks,
Andrew
I will submit the EA later, I don't have much free times, works and family are too busy to think about trading live.
How to use Range indicator?
This thread is now fading or something, can anyone please explain me how to use range as shown in the picture? I am learning, please share your knowledge. I am seriously, I am reading BabyPips, but still don't get it. Thanks in advance.
Andrew
Where Ishmael? I hope that I don't spam your guys, we need master Xard back:-)
I got a little information about range.
I am getting a hang of it. Basically, take the H/L for each day. for the past 1/14/20/50 days.
For each day list the amount of pip's between the H and L.
Example for GBPJPY. I guess different pair has different range.
The number is as follows (number for 09/03/2012) :
Average Range for past 5 days : 164.02 pips
Average Range for past 10 days :160.02 pips
Average Range for past 30 days :136.98 pips
Then we AVERAGE this three numbers as I stated earlier :
Average = 164.02 + 160.02 + 136.98 / 3
= 153.74
From BabyPips:
This guy used the Average and multiply it with Fibonaci.
Once we got that number (153.74), we calculate it again based on fibonacci retracement.
Two retracement numbers, 0.618 and 0.786.
The calculation as follows :
Projection 1 : 153.74*0.786 = 120.835 pips
Projection 2 : 153.74 * 0.618 = 95.00 pips
I had looked at XARD Range indicator, different people calculated different combination of number of days than average them. I guess only those who are making profits will know the answer.
My question is that, when should we enter the trade if Today range > 100?
If GPBJPY range average from XARD indy is 131, and today range is 50, should we wait until it passes 100? or 131?
Sorry guys, since XARD included this indicator in his template, so I guess I did not violate this thread. We all want to understand. If there is a thread for range, please give me a link. Thanks.
Andrew
The Range board is only to give you an idea of how much movement that particular pair has been moving.
Some believe this to be a good indication if a pair has been giving off
Good movement.
You want to trade pairs with higher range movement thinking that when you get
An entry from a pair with higher range you will more than likely get more pips
With your trades compared to those with an average of small range movement.
At least thats my take on it.
Ish
By the way Andrew. Your doing great. Keep it up!
You will be bathing in pips in no time.
The Range board is only to give you an idea of how much movement that particular pair has been moving.
Some believe this to be a good indication if a pair has been giving off
Good movement.
You want to trade pairs with higher range movement thinking that when you get
An entry from a pair with higher range you will more than likely get more pips
With your trades compared to those with an average of small range movement.
At least thats my take on it.
Ish
You will be bathing in pips in no time.I wish I would be bathing PIPS one day.
Thanks for your reply. I understood now. I won't post for awhile now. My Spring Break is over, it is time for busy bee life.
Andrew
lol karl ditmann god bless all those that sink in his indicators
but seriously where do i get hte indis and template for this here set of charts??
Ismael360????????
Come on Mofo.
Very nice setup that AAA Chart .
.
To bad there are more using it.
Ishnever mind found the AAA files
lol karl ditmann god bless all those that sink in his indicators
but seriously where do i get hte indis and template for this here set of charts??
Ismael360????????Master Xard informed me yesterday he became grandfather of a beautiful baby boy !!!!!
Guess he has more important matters on his hands at the moment, lol !!!
CONGRATS Xard !!!!Wow, I had no idea Xard was old enough to be a grandfather. Congratulations and all the best to Xard!