AUD/NZD pair
Can anyone tell me which pair has a high corrolation with the AUD/NZD, ie goes in the opposite directon.
Thanks
Dave
=================
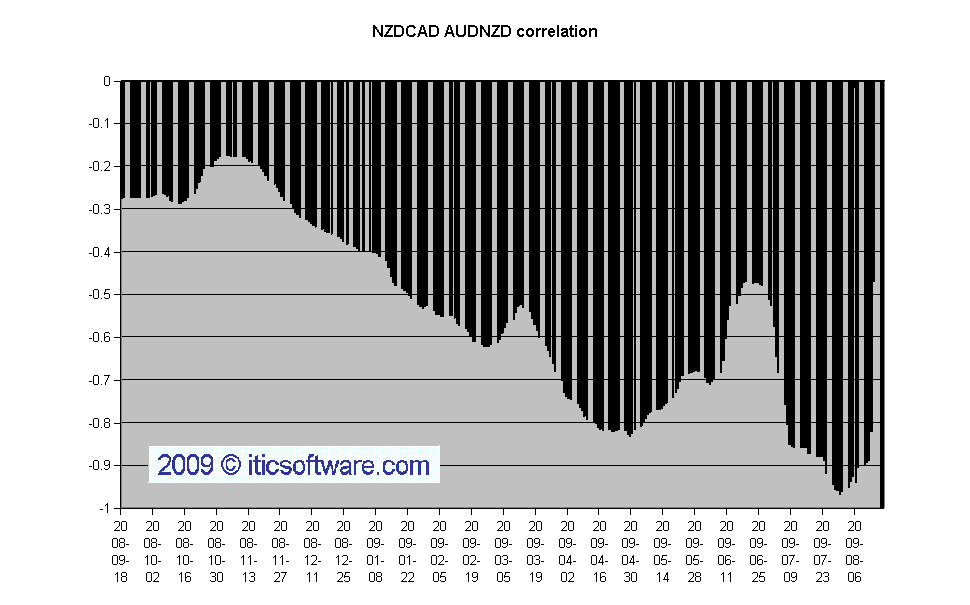
See correlation.
AUD\NZD NZD\CAD
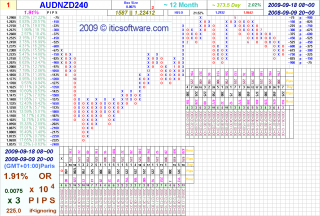
Review AUDNZD
P&F AUDNZD15 Box Size 10X4 or(0.33%) HI/LO
Data 1.2365 - 1.2112 ~ 1 Month ~ 34.85 Day
Database 1501 records 1.22417 (Last Close)
2009-08-14 12~15
2009-09-18 08~45 (GMT+01:00) Paris
1.2370|~1O|||____________________________________________________|-0.04%|2.13%
1.2360|~2O|||x___________________________________________________|0.04%|2.05%
1.2350|~3O|||__o_________________________________________________|0.12%|1.96%
1.2340|~4O|||__o_________________________________________________|0.2%|1.88%
1.2330|~5O|||__o_________________________________________________|0.28%|1.8%
1.2320|~6O|||__o_________x___x___________________________________|0.36%|1.72%
1.2310|~7O|||__o_________x_o_x_o_________________________________|0.44%|1.63%
1.2300|~8O|||__o_x_______x_o_x_o_________________x_______________|0.53%|1.55%
1.2290|~9O|||__o_x_o_x___x_o_x_o_________________x_o_x___________|0.61%|1.47%
1.2280|~1OO||__o_x_o_x_o_x_o_x_o_x_______________x_o_x_o_x_______|0.69%|1.39%
1.2270|~11O||__o_x_o_x_o_x_o_x_o_x_o_x___x_______x_o_x_o_x_o_x___|0.77%|1.3%
1.2260|~12O||__o_x_o_x_o_x_o_x_o_x_o_x_o_x_o_____x_o_x_o_x_o_x_o_|0.85%|1.22%
1.2250|~13O||__o___o_x_o_x_o_x_o_x_o_x_o_x_o_____x_o_x_o_x_o_x_o_|0.93%|1.14%
1.2240|~14O||______o___o___o_x_o_x_o_x_o_x_o_x___x_o_x_o___o_x_o_|1.01%|1.06%
1.2230|~15O||______________o_x_o_x_o_x_o___o_x_o_x_o_x_____o_x_o_|1.09%|0.97%
1.2220|~16O||______________o_x_o_x_o_x_____o_x_o_x_o_x_____o_x___|1.17%|0.89%
1.2210|~17O||______________o_x_o___o_x_____o_x_o_x_o_x_____o_____|1.25%|0.81%
1.2200|~18O||______________o_______o_x_____o_x_o_x_o_____________|1.33%|0.73%
1.2190|~19O||______________________o_______o_x_o_x_______________|1.42%|0.64%
1.2180|~2OO||______________________________o_x_o_________________|1.5%|0.56%
1.2170|~21O||______________________________o_x___________________|1.58%|0.48%
1.2160|~22O||______________________________o_x___________________|1.66%|0.4%
1.2150|~23O||______________________________o_x___________________|1.74%|0.31%
1.2140|~24O||______________________________o_x___________________|1.82%|0.23%
1.2130|~25O||______________________________o_x___________________|1.9%|0.15%
1.2120|~26O||______________________________o_____________________|1.98%|0.07%
1.2110|~27O||____________________________________________________|2.06%|-0.02%
Column|~28O||1_115_6_5_5_8_1212117_9_8_4_4_15126_12109_5_4_7_6_4_|
Count
Hi,
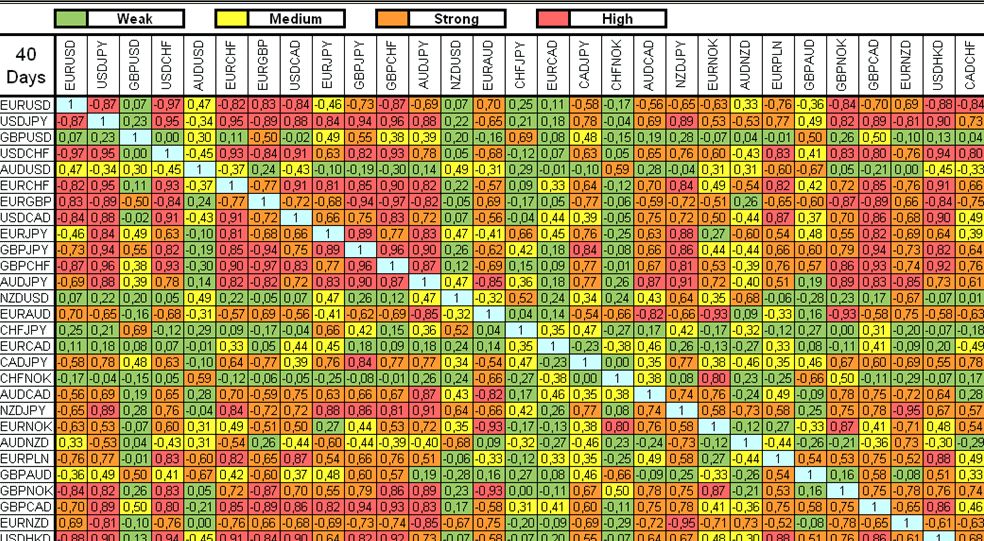
Can't remember where i got this table, but you'll find AUDNZD (the 22nd down the left list) and can see the various correlations % and negative correlations % with different pairs.
Hope this helps,
Happy trading,
Ms_Mel
Hi,
I don't understand What are you really want to say.
So please clear with your thoughts.So, We understand you easily
And may provide some better help to you.
I will gonna happy to help you.
Thanks
___________________
Today, the AUD/NZD reached a level close to its resistance at 1.2700. As you can see, this is the third time the market is trading around this point while it's still inside the bullish trend channel, which was established around the end of September. If the market doesn't break this level, it might return back towards the lower line of the channel and the support of around 1.2435[actionforex]
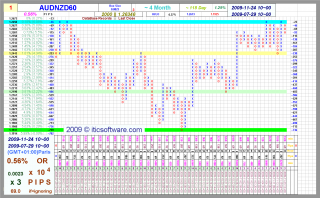
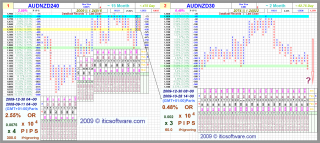
"P&F AUDNZD240 Box Size 35X5 or(1.41%) HI/LO
Data 1.2932 - 1.1925 ~ 8 Month ~ 244.83 Day
Database 1050 records 1.264 (Last Close)
2009-03-24 12~00
2009-11-24 08~00 (GMT+01:00) Paris
BJF Trading Group chart"
1.2915|~35|||_____X________________|0.13%|8.3%
1.2880|~7O|||_____XoX______________|0.4%|8.01%
1.2845|~1O5||_____XoXo_____________|0.67%|7.71%
1.2810|~14O||_____XoXoX____________|0.94%|7.42%
1.2775|~175||_____XoXoXo___________|1.21%|7.13%
1.2740|~21O||___X_XoXoXo___________|1.48%|6.83%
1.2705|~245||___XoXoXoXo___________|1.76%|6.54%
1.2670|~28O||___XoXoXoXoX_______X_X|2.03%|6.25%
1.2635|~315||___XoXoXoXoXoX_____XoX|2.3%|5.95%
1.2600|~35O||___XoXoXoXoXoXo____XoX|2.57%|5.66%
1.2565|~385||___XoXo_oXoXoXo____XoX|2.84%|5.37%
1.2530|~42O||___XoX__oXoXoXo____XoX|3.11%|5.07%
1.2495|~455||___Xo___oXoXoXo____XoX|3.38%|4.78%
1.2460|~49O||___X____oXoXoXo____Xo_|3.65%|4.49%
1.2425|~525||_X_X____oXoXoXoX___X__|3.92%|4.19%
1.2390|~56O||oXoX____o_o_oXoXo__X__|4.19%|3.9%
1.2355|~595||oXoX________o_oXo__X__|4.46%|3.61%
1.2320|~63O||oXoX__________oXo__X__|4.73%|3.31%
1.2285|~665||oXoX__________oXo__X__|5%|3.02%
1.2250|~7OO||oXoX__________oXo__X__|5.27%|2.73%
1.2215|~735||oXoX__________oXoX_X__|5.54%|2.43%
1.2180|~77O||oXoX__________oXoXoX__|5.82%|2.14%
1.2145|~8O5||oXoX__________o_oXoX__|6.09%|1.84%
1.2110|~84O||oXoX____________oXoX__|6.36%|1.55%
1.2075|~875||o_oX____________oXoX__|6.63%|1.26%
1.2040|~91O||__o_____________oXoX__|6.9%|0.96%
1.2005|~945||________________o_oX__|7.17%|0.67%
1.1970|~98O||__________________oX__|7.44%|0.38%
1.1935|~1O15|__________________o___|7.71%|0.08%
1.1900|~1O5O|______________________|7.98%|-0.21%
Column|~1O85|1112711911189818168266|
Count|~112O||OO1O_2O_422___4_2__1__|
As noted before, while European currencies are generally weak, AUD and NZD are relatively resilient so far. Comparing the two, NZD seems to be even stronger. Last week's sharp fall in AUD/NZD confirmed that rise fro 1.1925 has completed at 1.2836 already, on mild bearish divergence conditions in daily MACD and RSI. We'd anticipate deeper fall in the cross to 61.8% retracement of 1.1925 to 1.2836 at 1.2273 and possibly below. In other words, we'd expect Kiwi to outperform the Aussie in near term.[Written by actionforex]
"P&F AUDNZD1440 Box Size 80X5 or(3.42%) CLOSED
Data 1.2904 - 1.0463 ~ 91 Month ~ 2799 Day
Database 2002 records 1.24516 (Last Close)
2002-05-02 00~00
2009-12-30 00~00 (GMT+01:00) Paris
BJF Trading Group chart"
1.2880|~8O|||____________________X__________|0.19%|23.1%
1.2800|~16O||____________________Xo__X_X____|0.81%|22.34%
1.2720|~24O||====================Xo==XoXo==X|1.43%|21.57%
1.2640|~32O||____________________Xo__XoXoX_X|2.05%|20.81%
1.2560|~4OO||____________________Xo__XoXoXoX|2.67%|20.04%
1.2480|~48O||____________________Xo__XoXoXoX|3.29%|19.28%
1.2400|~56O||______________X_____Xo__XoXoXoX|3.91%|18.51%
1.2320|~64O||____________X_Xo____Xo__XoXo_oX|4.53%|17.75%
1.2240|~72O||____________XoXo____XoX_XoX__oX|5.15%|16.98%
1.2160|~8OO||____________XoXo____XoXoXoX__oX|5.77%|16.22%
1.2080|~88O||____________XoXo____XoXoXo___oX|6.39%|15.45%
1.2000|~96O||============XoXo==X=XoXoX====o=|7.01%|14.69%
1.1920|~1O4O|_o__________XoXo__XoXoXoX______|7.63%|13.93%
1.1840|~112O|Xo__________XoXo__XoXo_oX______|8.25%|13.16%
1.1760|~12OO|XoX___X_____Xo_o__XoX__oX______|8.87%|12.4%
1.1680|~128O|_oXo__Xo____X__o__XoX__oX______|9.49%|11.63%
1.1600|~136O|_oXoX_Xo____X__oX_XoX__oX______|10.11%|10.87%
1.1520|~144O|_oXoXoXo____X__oXoXoX__oX______|10.73%|10.1%
1.1440|~152O|_oXoXoXo____X__oXoXoX__oX______|11.35%|9.34%
1.1360|~16OO|_o_oXoXo____X__oXoXoX__oX______|11.97%|8.57%
1.1280|~168O|___oXoXo____X__oXoXoX__oX______|12.59%|7.81%
1.1200|~176O|___oXoXo____X__o_oXo___oX______|13.21%|7.04%
1.1120|~184O|___oXoXo__X_X____oX____oX______|13.83%|6.28%
1.1040|~192O|___oXo_oX_XoX____oX____oX______|14.45%|5.51%
1.0960|~2OOO|___oX__oXoXoX____oX____oX______|15.07%|4.75%
1.0880|~2O8O|___oX__oXoXoX____o_____oX______|15.69%|3.99%
1.0800|~216O|___oX__oXoXoX__________o_______|16.31%|3.22%
1.0720|~224O|___oX__oXoXoX__________________|16.92%|2.46%
1.0640|~232O|___o___oXoXoX__________________|17.54%|1.69%
1.0560|~24OO|_______oXo_oX__________________|18.16%|0.93%
1.0480|~248O|_______o___oX__________________|18.78%|0.16%
1.0400|~256O|___________o___________________|19.4%|-0.6%
Column|~264O|2851179176792781591121512996489|
Count||~272O|___42__6____4__5__4O13_85______|
AUD/NZD extended the correction from 1.3210 and dipped to as low as 1.2873 so far. Some more down would possibly be seen in the cross in near term as correction extends further towards 50% retracement of 1.2408 to 1.3120 at 1.2764 and the development will possibly limit Aussie's gain against Dollar and Yen. Nevertheless, we'd expect the correction to end near to 1.2764 and by then Aussie will start to outperform Kiwi again.
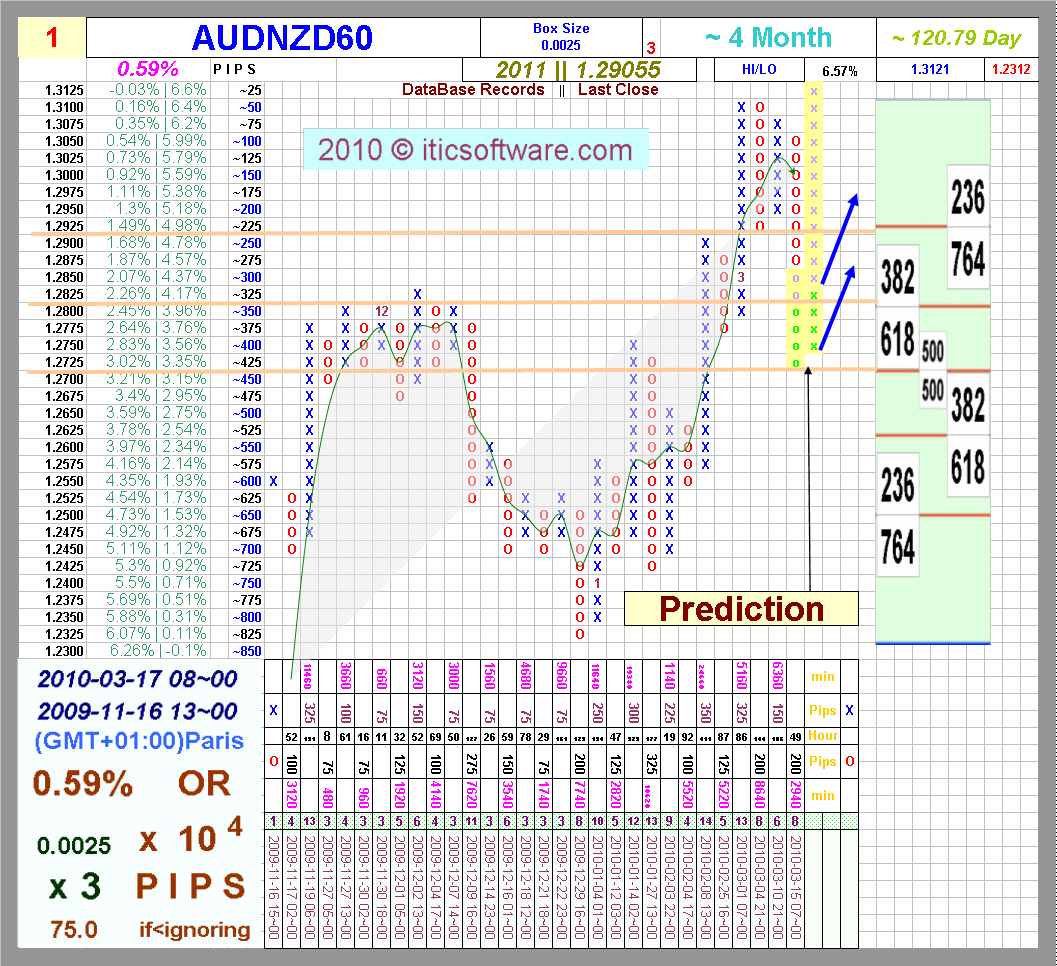
"P&F AUDNZD1440 Box Size 90X5 or(3.82%) HI/LO
Data 1.3121 - 1.0432 ~ 92 Month ~ 2799 Day
Database 2001 records 1.29087 (Last Close)
2002-07-18 00~00
2010-03-17 00~00 (GMT+01:00) Paris
BJF Trading Group chart"
1.3050|~9O|||______________________________________________x_|0.54%|25.1%
1.2960|~18O||__________________________x___________________x_|1.23%|24.23%
1.2870|~27O||__________________________x_o_________x___x___x_|1.91%|23.37%
1.2780|~36O||__________________________x_o_________x_o_x_o_x_|2.6%|22.51%
1.2690|~45O||__________________________x_o_________x_o_x_o_x_|3.28%|21.64%
1.2600|~54O||__________________________x_o_________x_o_x_o_x_|3.97%|20.78%
1.2510|~63O||__________________________x_o_________x_o_x_o_x_|4.66%|19.92%
1.2420|~72O||______________x___x_______x_o_________x_o_x_o_x_|5.34%|19.06%
1.2330|~81O||______________x_o_x_o_____x_o_________x_o_x_o_x_|6.03%|18.19%
1.2240|~9OO||______________x_o_x_o_____x_o_____x___x_o_x_o_x_|6.71%|17.33%
1.2150|~99O||______________x_o_x_o_____x_o_____x_o_x_o_x_o_x_|7.4%|16.47%
1.2060|~1O8O|______________x_o_x_o_x___x_o_____x_o_x_o___o_x_|8.09%|15.61%
1.1970|~117O|______________x_o_x_o_x_o_x_o_____x_o_x_____o___|8.77%|14.74%
1.1880|~126O|______________x_o_x_o_x_o_x_o_____x_o_x_________|9.46%|13.88%
1.1790|~135O|__x___x_______x_o___o_x_o_x_o_____x_o_x_________|10.14%|13.02%
1.1700|~144O|__x_o_x_o_____x_____o_x_o_x_o_____x_o___________|10.83%|12.15%
1.1610|~153O|o_x_o_x_o_____x_____o_x_o_x_o_____x_____________|11.52%|11.29%
1.1520|~162O|__x_o_x_o_____x_____o_x_o_x_o_____x_____________|12.2%|10.43%
1.1430|~171O|__x_o_x_o_____x_____o_x_o_x_o_x___x_____________|12.89%|9.57%
1.1340|~18OO|__x_o_x_o_____x_____o_x_o_x_o_x_o_x_____________|13.57%|8.7%
1.1250|~189O|____o_x_o_____x_____o_x_o_x_o_x_o_x_____________|14.26%|7.84%
1.1160|~198O|____o_x_o_x___x_____o_x_o___o_x_o_x_____________|14.95%|6.98%
1.1070|~2O7O|____o_x_o_x_o_x_____o_x_____o_x_o_x_____________|15.63%|6.12%
1.0980|~216O|____o_x_o_x_o_x_____o_______o_x_o_x_____________|16.32%|5.25%
1.0890|~225O|____o_x_o_x_o_x_____________o_x_o_______________|17%|4.39%
1.0800|~234O|____o_x_o_x_o_x_____________o_x_________________|17.69%|3.53%
1.0710|~243O|____o___o_x_o_x_____________o___________________|18.38%|2.66%
1.0620|~252O|________o_x_o_x_________________________________|19.06%|1.8%
1.0530|~261O|____________o_x_________________________________|19.75%|0.94%
1.0440|~27OO|____________o___________________________________|20.43%|0.08%
1.0350|~279O|________________________________________________|21.12%|-0.79%
Column|||||||1_6_1_1_1_7_8_2_7_7_1_1_1_2_2_8_6_1_6_1_9_9_1_1_|
Count|~297O||____2_2_3_____2_____6_2_0_0_5_____5___3_____0_2_|
AUDNZD Dips Remain Attractive To Buyers
Technical Bias: Bullish
Key Takeaways
• Australian dollar remains elevated against the New Zealand dollar.
• Possible inverse head and shoulders formation might the AUDNZD pair higher.
• USDJPY support at 1.0800, and resistance at 1.0870.
Australian dollar after failing around the 1.0880 resistance zone has moved lower against the New Zealand dollar. However, the pair found buyers to hold an important support area, which suggests that it might gain traction again in the short term.
Technical Analysis
The AUDNZD pair traded higher towards an important resistance zone earlier during the week. The pair found sellers around a critical bearish trend line connecting all recent swing highs. The failure to break the trend line resulted in a move lower towards a confluence support area of all three key simple moving averages (200, 100 and 50) on the 4 hour timeframe. The 38.2% Fibonacci retracement level of the last leg higher from the 1.0654 low to 1.0879 high also sits around the same confluence zone. Currently, the pair is consolidating around the mentioned support area. However, if we analyze closely, then there is a possibility of an inverse head and shoulders pattern formation if the pair dips close to the 50% fib level. If this pattern takes hold, then a move higher towards the 1.0900 is possible in the coming days. A break and close below the 61.8% fib would invalidate this pattern.
Moreover, it cannot be denied that the pair might find sellers again around the highlighted trend line. Any failure to break the trend line could ignite a fall in the AUDNZD pair moving ahead. In the near term, the support area of all three key SMA’s hold the key for the pair. If buyers give up, then it would be interesting to see how the pair reacts around the 50% fib level.
Overall, the market sentiment still favors more gains in the AUDNZD pair. However, this could easily change if the pair drops below the important support area moving ahead.
AUD/NZD: Aussie Trades at Highest Level in 2015
The Australian dollar accelerated versus it's New Zealand counterpart on Wednesday, after post Reserve Bank of Australia (RBA) gains were supported by strong Q1 GDP figures.
Australia's economy grew at a very healthy rate in the first quarter, which will probably prompt some suggestions that it has weathered last year's fall in commodity prices well. The seasonally-adjusted 0.9% quarter-on-quarter expansion in Q1 was slightly above expectations. It marked an acceleration from 0.5% in Q4, although in annual terms growth slowed to 2.3% from 2.5% in the previous quarter.
"We think the worst is still to come. The end of the mining investment boom and the lagged effects of lower commodity prices will continue to drag on the economy over the rest of the year, while the temporary support for consumer spending from lower oil prices will soon fade," Capital Economics commented on the Australian GDP figures.
The aussie added 0.44% versus the kiwi to $1.0866, consolidating from it's earlier peak of $1.0887, which was this year's high.
The RBA's decision in the previous session suggested that the central bank looks to stand pat for at least the next 3-4 months which initially boosted the aussie.
"The economy is likely to be operating with a degree of spare capacity for some time yet. With very slow growth in labor costs, inflation is forecast to remain consistent with the target over the next one to two years, even with a lower exchange rate," RBA Governor Glenn Stevens said in the statement on Tuesday.
- Free trading apps
- Over 8,000 signals for copying
- Economic news for exploring financial markets
You agree to website policy and terms of use
Can anyone tell me which pair has a high corrolation with the AUD/NZD, ie goes in the opposite directon.
Thanks
Dave