TwinBlade 5mint System
Example how it works...
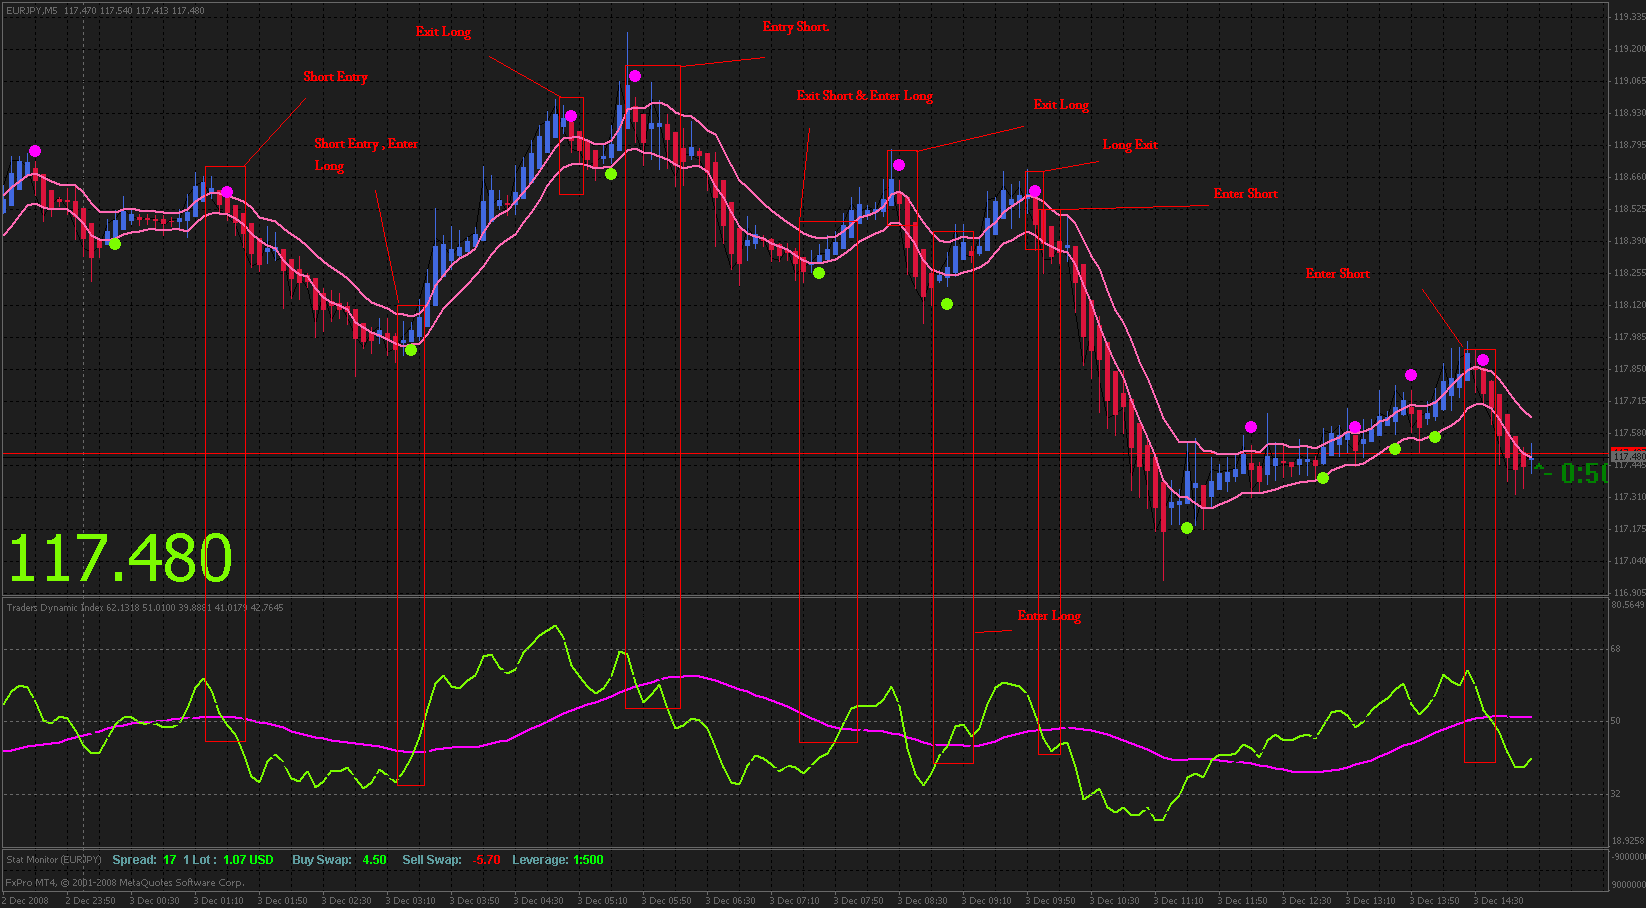
This example was part Asian session and part London session, but for best results and to avoid dead/range market and to gain on the big moves, only trade from London session start to US session close. The most best times are when London, Euro and US sessions are open at same time.

Thank you for your information, very usefull to me.
Once again, thank you
ServerUang
hi
thanks for share your system, not heineken but heiken ashi , heineken is a beer brand  just joke heiken ashi = heineken and asahi beer
===================
thanks for share your system, not heineken but heiken ashi , heineken is a beer brand
just joke heiken ashi = heineken and asahi beer
===================
Forex Indicators CollectionHICK ! HiPs !
We are all on the same boat.
Hey, why i see 2 boats.
PS : Sorry for the pic, just couldn't resist.
from my experiences using the twinblade system..
Mondays & Fridays are the best days to catch the big moves. Almost every Mondays there's a big gain trend and almost every Fridays during the last hours of the market there always another bull/bear rally before the market closes.
Sessions also are times when you can make big gains usually. Almost every time London opens there's a big movement right after the session starts and almost every time 1hour after US opens there's a big move, due to the NY stock market opens and the dow jones index.
Also times when you can make big gains are when the Nikkei 225 is significantly up or down and also times to make big gains are when the Dow Jones is significantly up or down.
Why the relation between Nikkei 225 and Dow Jones with euro-yen and pound-yen?
Its because of its effect with the USDJPY, since its one of the major movers for almost all the YEN pairs.
So these are the times u really need to be watching the market, its really easy 100-200pips+ if your awake for the start of London session and the start of NY stock market open and if u see Nikkei 225/Dow Jones Index in significant moves.
Also you will trade mechanically after the London/nystock has finished it moves, Its more important to understand how the system works rather than just blindly following what it says.
A little bit of understanding...
The Dot is a immediate trend indicator, it would show u a dot each time the immediate trend has changed, so if your seeing a dot its trying to tell you which side the market is gonna probably move.
The Heiken Ashi candles with the 2 moving averages, The Heiken Ashi candles being used are based upon the average of previous close+previous open+open+high+low+close to tell u which way price is moving. Its way way better than watching normal candles, since normal candles would only base itself with the open+high+low+close of the timeframe your viewing. The 2 Moving averages are 5 period smoothed moving averages based on the average of high prices and the average of low prices, So it acts like a moving support and resistance line and a candle breakout from these lines tells you a strong move is going on and you should be watching these times if all the other conditions are met so you can get an entry. Please remember we need the candle to breakout and close above/below those 2 moving averages and not Wicks made above or below the moving average lines.
The green/pink lines is basically the Traders dynamic index indicator, by default there's supposed to be 3 lines and a boilinger band of which ive disabled the boilinger band and the 3rd line, so that we can see only whats needed for the trade. The green line is a RSI - relative strength index, its a volumes based indicator, volumes are the size of trade people are investing, you can open the "new order" in metatrader and there it would state "volume" for the size of the trade like 0.10, 1lot, 10lots ect. So in the green/pink window we are seeing which way the volume of money's flowing in the market.
Ive suggested to DEMO TRADE ATLEAST 1 WEEK, because the market will teach you a lot of things and also you would get the hang of using this method.
Id also like to mention, you can switch the timeframe on the chart and you can also analyze 15m,30m,1hour,4hour,daily using the template. But remember that LAG=Losses, especially for the euro-yen and pound-yen. Because if you check the 5 mint chart you will see it does 100pips in like 20-30minutes, so you can make too much money from a 5min chart than a 4hour on these pairs.
About trading in range market, I've already written, you can trade hit-n-run and take 10-20pips on the signal and get out of the trade that way...
Also remember, money management is the key, so do not trade more than 1-10% of your balance per trade. Trust me if your trading 10% of your balance and you do 100pips a day. In like 50-60 days you can grow 1000USD to over 1Million USD!!
Hope the system can make u a lot of pips and my explanation is of help.
TwinBlade System v0.1
---------------------------------
No Significant changes done, except some audio/visual improvements and some visual aids.
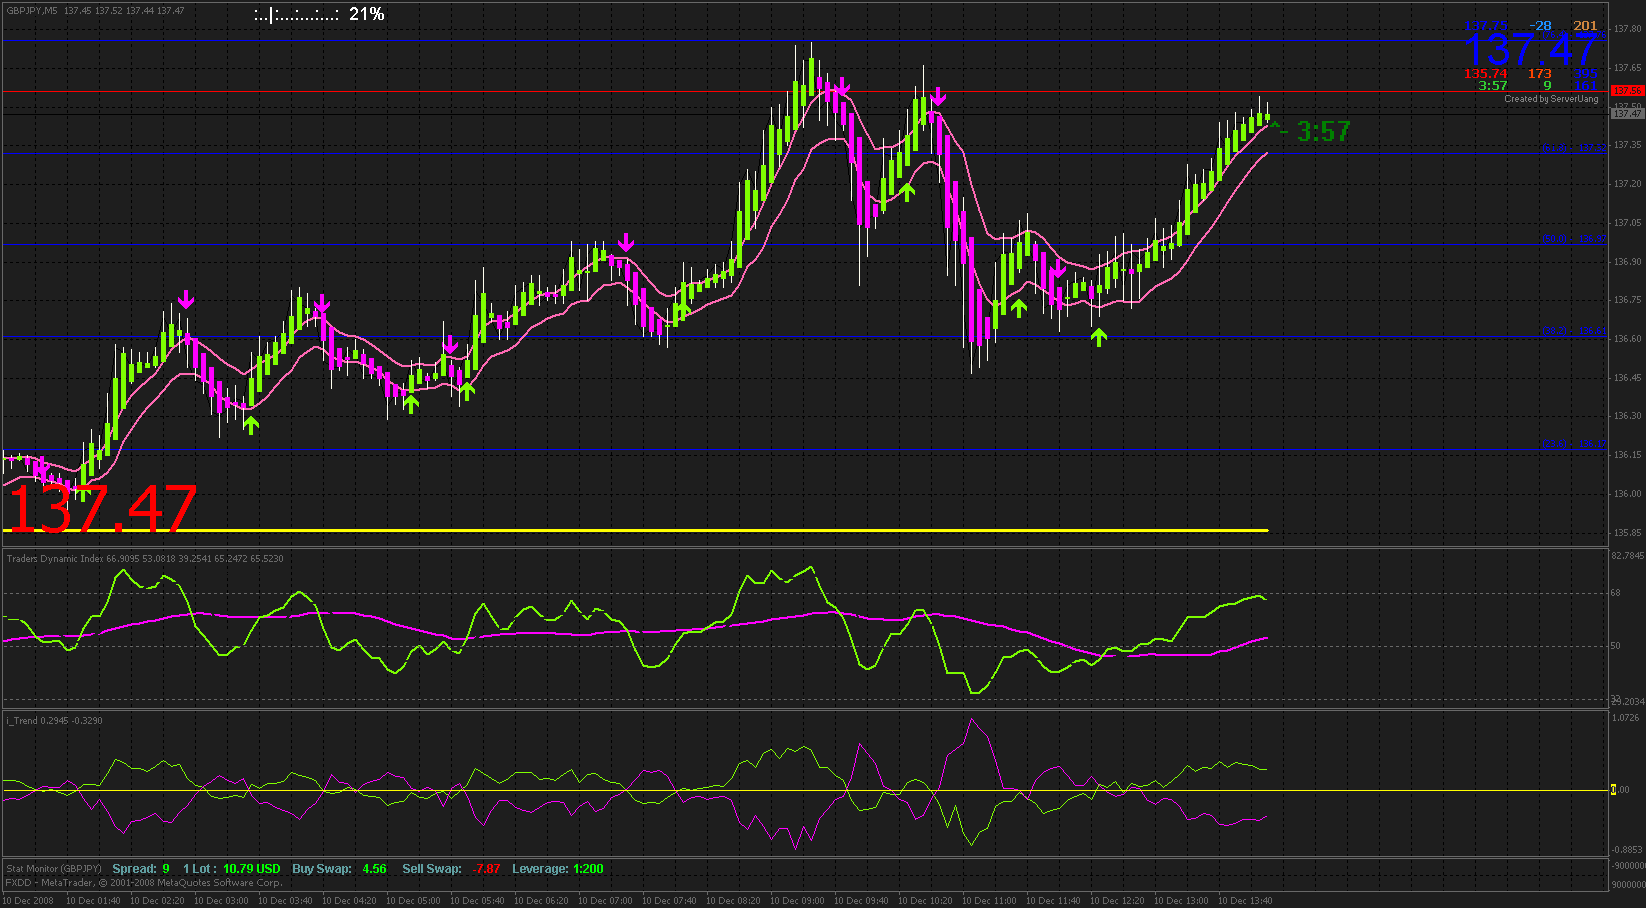
* Modified Heiken Ashi candles - Now you can see the white colored wicks from the green/pink bodies of the candles.
* Added Daily open line - Yellow line that will show you the distance from the daily candle open price.
* Added ASCTrend Sound Sandy - This indicator is a replacement for the dots indicator, it works somewhat the same way like the dots, except that it doesn't repaint and also you can setup sound/message box alerts and even pop3 e-mail alerts.
* Added Daily fibbo levels - You can now see the daily high/low of previous day and the retracement/extension levels. Blue is the daily fibbo, red is retracement levels down from low, aqua is extension levels up from high.
* Added Market Price - This indicator will provide some useful information's like, High/Low, pip distance from high, pip distance from low, Pips from high to low, daily average, distance from day's open, time & spread.
* Added iTrend indicator - This is a very important trend reader, when the pink and green line crosses it will tell you which way the trend and also the distance from the 0 level will tell you how strong that trend is moving on the 5mint chart.
* Added Bartimer - Its just a fancy indicator to tell u how much percentage of the bar is complete.
Installation
------------
Copy all the .mq4 and .ex4 files to experts/indicators folder
Copy the .tpl to /templates folder
Load the chart with the "twinblade_system_v0.1.tpl" template to pre-load everything.
With Twinblade v0.1 , all you need to do is wait for the ASCtrend to alarm you with the box/sound. Then just check if the candles are breaking out from the moving averages, check if green rsi crossed the pink line and check if Itrend crosses and are away from the 0 line and you have a potential trade there !
Hope this will help improve your trading on the system. 
hi dz !
is there a problem between u and ff ?
btw..nice system.. 
hi dz !
is there a problem between u and ff ?
btw..nice system.. Check my topic on FF, maybe some more useful info on this system.
Yeah, the admin banned me due to i send a link to my buddies in the PM. 
hi
good system ,where exactly SL put? how many pips?
===================
MA Channel
Hi,
Do you always wait for the HA Candle to close outside the MA channel? I have noticed that you would enter the trade later if you always wait for this -but maybe you have found that is better.
Paul.
- Free trading apps
- Over 8,000 signals for copying
- Economic news for exploring financial markets
You agree to website policy and terms of use
I created this system for the most popular Japan Yen pairs, and i hope it will make u feel like a samurai with a double edged sword!
OK 1st thing you may know, Japan yens have a correlation, especially with the Euro-Yen and Pound-Yen. So we are going to use these 2 pairs together since they really act like twin sisters.
Entry/Exit rules for Buy trade
----------------------------
Buy Entry - Wait for blue Heineken Ashi candle + green dot + make sure the green RSI is crossed over the Pink base line.
Buy Exit - If red Heineken Ashi candle forms or if Pink dot appears or if Green RSI crossed below the Pink Base Line.
Entry/Exit rules for Sell trade
----------------------------
Sell Entry - Wait for red Heineken Ashi candle + Pink dot + make sure the
Green RSI is crossed below the Pink base line.
Sell Exit - If Blued Heineken Ashi candle forms or if Green dot appears or if Green RSI crossed above the Pink Base Line.
Stoploss & Targets
------------------
No recommendation for stoploss, thats is up to you. For Targets, If you want you can wait for the exit terms and eat the whole pie or if you want you can hit n run 10-20pips on every trade signal and take bites, its all up to you.
Trade Session
-------------
From London Open Session to USA session close. You can find the session time from this website, World Financial Markets -- Current Open/Closed Status, Opening and Closing Times, and Holiday Schedule, Expressed in Terms of Your Local Time Zone
Time Frame
-----------
Only 5min chart and you must have chart for euro-yen and pound-yen both side by side Tiled vertically in metatrader. Like this...
Note : Included is a candle countdown timer, so you have to make sure the candle is closed before considering any of the entry/exit signals to prevent fake outs on the live candles.
Installation
------------
Copy all the .ex4 files to experts/indicators folder
Copy the .tpl to /templates folder
Load the chart with the "twinblade_system.tpl" template to pre-load everything.
Note 2 : Please demo trade at least a week before you trade live.
Note 3 : There are 2 pink 5 period moving averages of high/low prices. If the candles are moving inside those 2 moving averages, its usually not a strong market or a ranging scenarios, and if the candles are breaking out of the high/low MA's its a strong market and trending scenario.
Some more things to help & notice.
---------------------------------
Nikkei 225
Before London/euro opens, make sure to check the Nikkei 225. If it is significantly up ... euro-yen and pound-yen would probably go up after London opens.
Before London/euro opens, make sure to check the Nikkei 225. If it is significantly Down ... euro-yen and pound-yen would probably go down after London opens.
Dow Jones Industrial
1 Hour after US session opens, make sure to check the Dow Jones Index, If it is significantly up.....Euro-yen and Pound-yen would probably go up.
1 Hour after US session opens, make sure to check the Dow Jones Index, If it is significantly down.....Euro-yen and Pound-yen would probably go down.
----------------------
You can check for Nikkei here --> Nikkei Net Interactive - Markets Japan
You can check the Dow Jones here --> PCQuote | Empowering the Individual Investor
If u notice significant up or down in the Nikkei and/or Dow Jones. Be ready to make 100's of pips excess. If there are no significant up's or down's in them, it will probably be a normal market.
Note 4: Some more detailed explanation for your understanding of how the system works, click over here.
New Version! TwinBlade System V0.1
(same rules as older version but with a newer approach) -----> Click here
V0.1.2 Special thanks to "pipetrader" over here
V0.2 Special thanks to "pipetrader" over here
Enjoy earning pips and your contribution to better this system is more than welcomed!