But maybe we need to filter a bit this wide ideas of being long or short and being more specific.
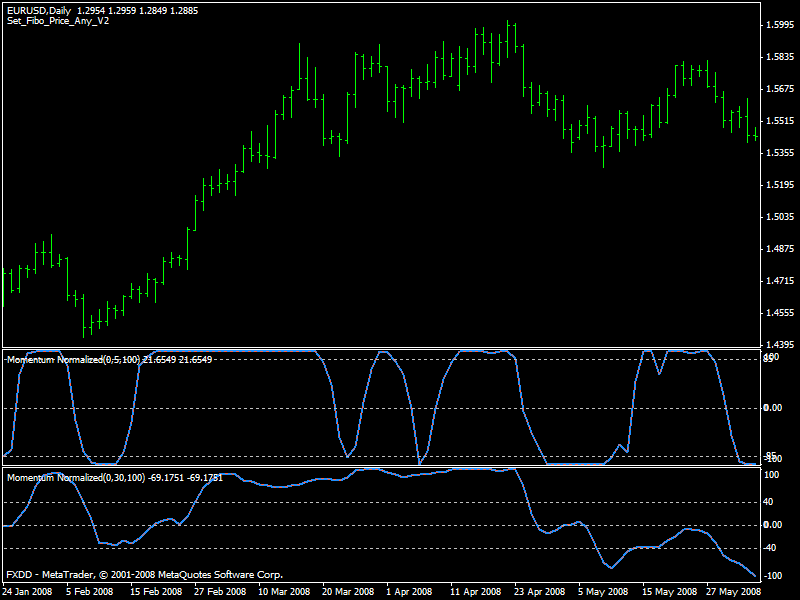
1. If the current 30-day momentum is greater than 40 (40 percent), the momentum is up and conditions are established for a buy signal.
2. If the current 30-day momentum is less than -40 (-40 percent), the momentum is down and conditions are established for a sell signal.
The actual trade triggers are:
1. Go long when the 30-day momentum is above 40 and the five-day momentum is below -85 (-85 percent).
2. Go short when the 30-day momentum is below -0.40 and the five-day momentum is above +85 (+85 percent).
You could add the levels manually or download my template.
A second stronger approach is to set the levels of long momentum to 60 to separate long from shorts setups and a 10/60 days momentum were added with new thresholds.
So, we have now:
1. Go long on the next day’s open when the 30-day momentum is above 60 and the five-day momentum is below -80 (-80 percent).
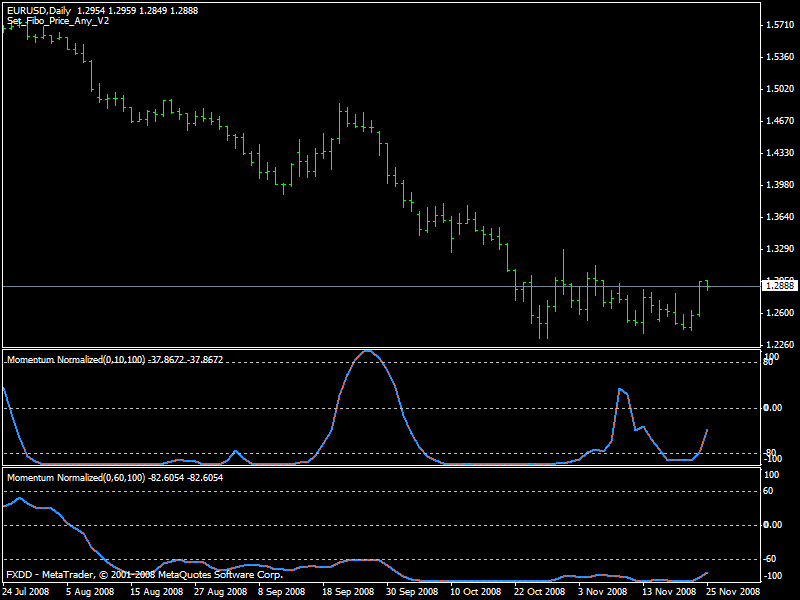
2. Go short on the next day’s open when the 60-day momentum is below -60 and the 10-day momentum is above 80 (+80 percent).
Note: The trade-trigger thresholds for the shorter-term momentum calculation were “loosened” from +/-85 in the original strategy because the longer-term
look-back period was “tightened” from +0.60/-0.60
3. Exit after five days.
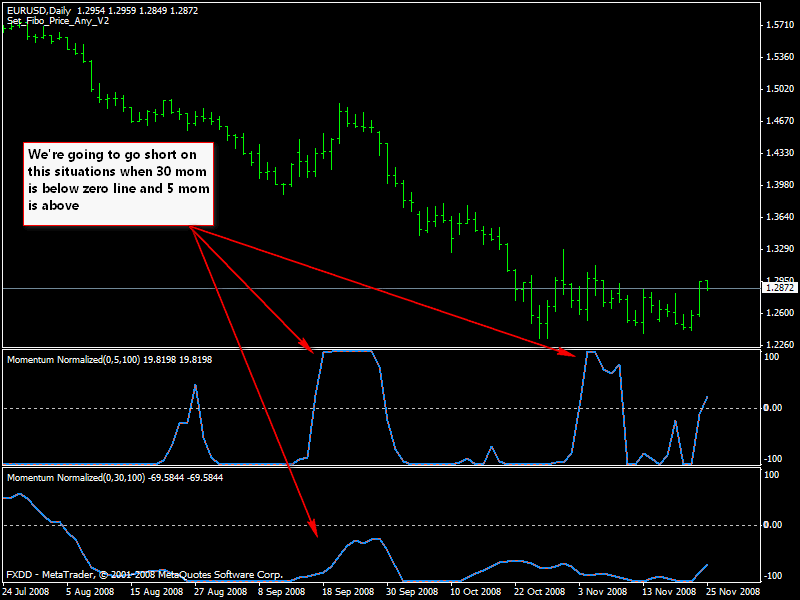
Short setup:
Exits
According to back test we could define best exit strategies.
1. Exit long trades on the close when there is an open profit of .0440 or more.
2. Exit short trades on the close when there is an open profit of .0240 or more.
3. Exit all trades with a loss if the open loss is -.0085 or more.
4. Exit any remaining open trades after nine days.
We're talking about pips here 
Momentum strategy overview:
The strategy is based on a momentum calculation that measures where the current price is relative to the price range of the past n bars. For example, if a currency has traded between 1.2800 and 1.2850 over the past 10 bars (a range of 0.0050) and price is currently at 1.2845, the momentum reading would be 0.0045/0.0050 = 90 (or 90 percent) The indicator would be 100, or 100 percent, if the current price was at the top of the past 10 bars’ range. The calculations are modified to range between -100 and +100 rather than zero and 100.
For example, if the most recent price was 1.2805, the momentum indicator value would be -90 (-90 percent) instead of 100 (0.0005/0.0050).
The strategy uses two momentum calculations: a longer one that indicates whether the prevailing trend is up or down and a shorter one that indicates whether the market was a correction within that trend.
The original trade setup used a 30-day momentum calculation to represent the prevailing momentum or trend and a fiveday momentum calculation to find corrections, or pullbacks, within this trend.
These look-back periods were not optimized; they were simply selected as a starting point for analysis and testing. Figure A shows the EUR/USD pair with five- and 30-day momentum calculations.
After initial research that highlighted the influence of the long-term trend on the signals, and the differences between the long and short sides
of the market, the trade triggers ultimately tested were:
1. Go long when the 30-day momentum is above 0.60 and the five-day momentum is below -80 (80-percent negative).
2. Go short when the 62-day momentum is below -60 and the 10-day momentum is above +80 (80-percent positive).
To clarify, experimenting with look-back periods and trade lengths revealed the short-side trades fared much better using momentum indicator look-back periods approximately twice as long as those used for buy trades — e.g., doubling the initial five- and 30-day periods to 10 and 60 days improved overall performance considerably.
In this case, the 60-day look-back period produced exceptionally good results, so the period chosen for testing was 62 — another parameter in the same ballpark but with less-stellar results. (The goal is to keep the signals robust by consciously avoiding parameters that produce outlier performance.)
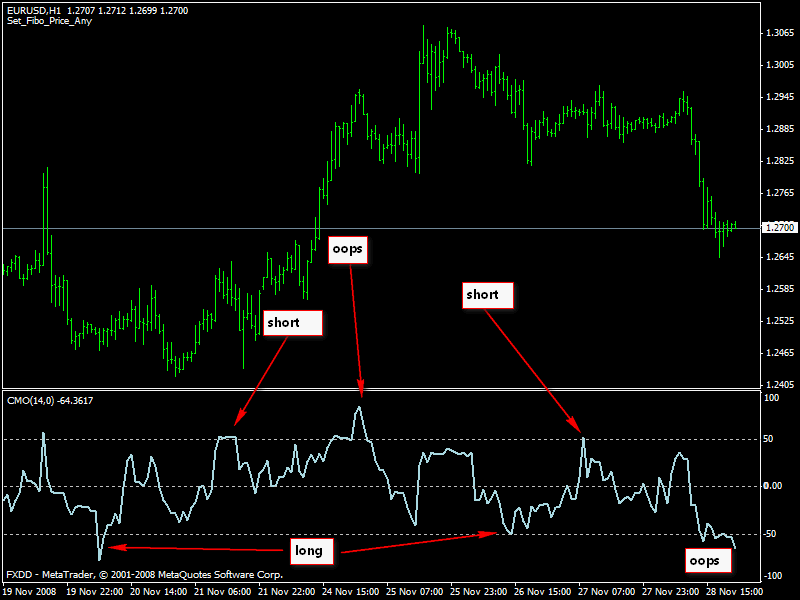
Now it's time to see if this strategy works for another majors and on intraday terms basis.
Great posts, I was wondering when you were gonna let us know how to use these =D
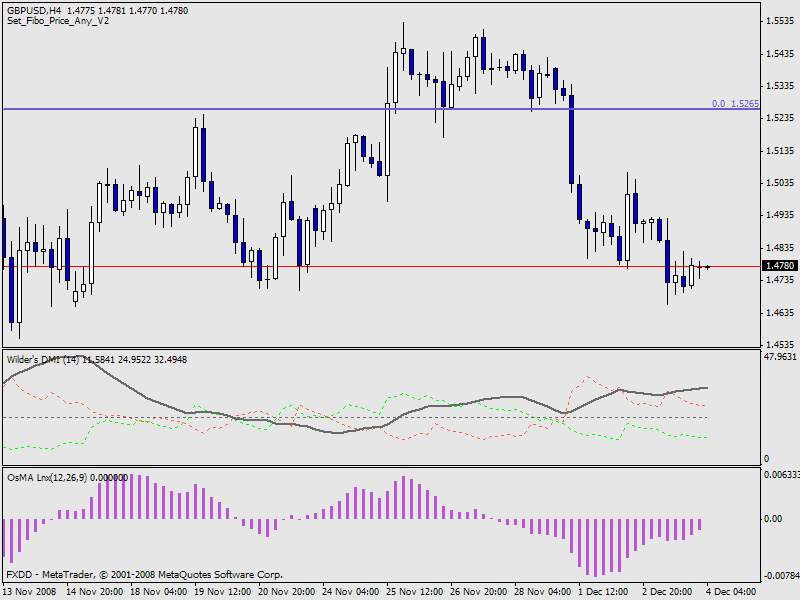
Coming back to the initial momentum system explained. According with this Cable chart we have a short on hands.
Short momentum above 80/85.
Long momentum below 40/60.
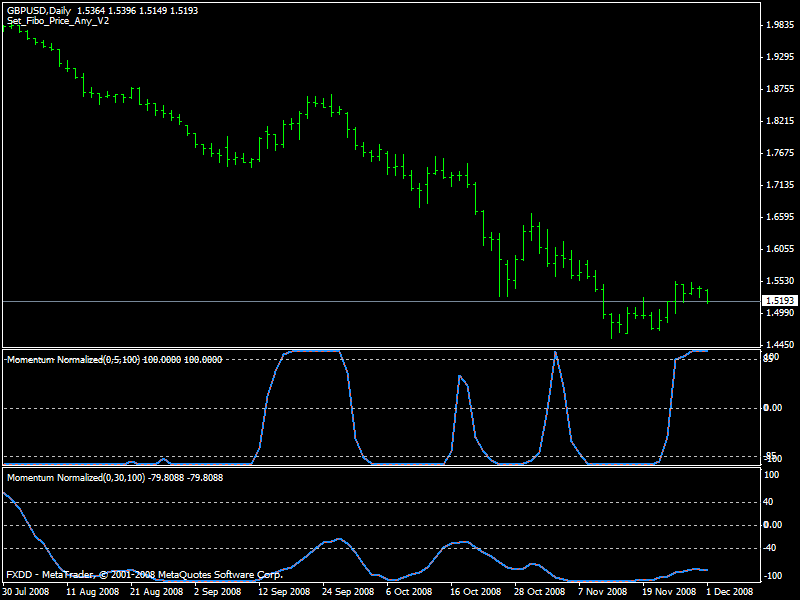
Note, last part of the system mentions a 10/62 days momentum values. By following that rules we must wait because short mom is below 80.
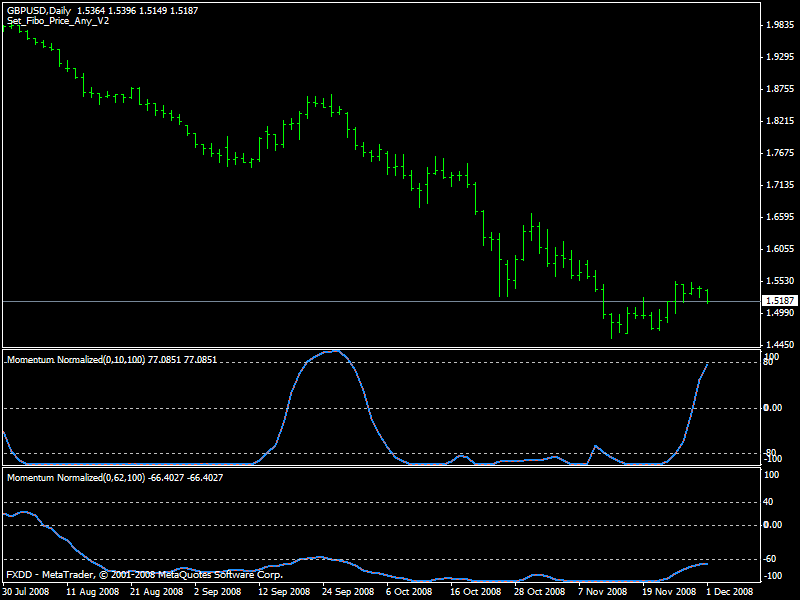
I will post the three templates in use later
On the Simple Trend Follower and LabTrend thread I've written about plain momentum trading. Starting from post 122of LabTrend to get an overall idea we could extend the discussion.
Some momentum indicators are RSI, Stochastic, MACD, Rate of Change and CCI.
Many pros have written about pure momentum trading. I like Linda Bradford Raschke.
You could create a free login at his website to see a few and nice articles.
Or get it some without create the login: https://www.lbrgroup.com/index.asp?page=MagazineArchive
His book Street Smart was a top on middle 90's.
Let's start with MACD Histogram, aka OsMA.
I made a simple mod just for this
- Free trading apps
- Over 8,000 signals for copying
- Economic news for exploring financial markets
You agree to website policy and terms of use


On 2008 Currency Trader Magazine dedicated three articles to this system.
Based on 10 years published back testing we could say results are very promising.
We had only one problem. The special momentum indicator needs to be developed and igorad do it in no time .
.
In general terms, the setup is:
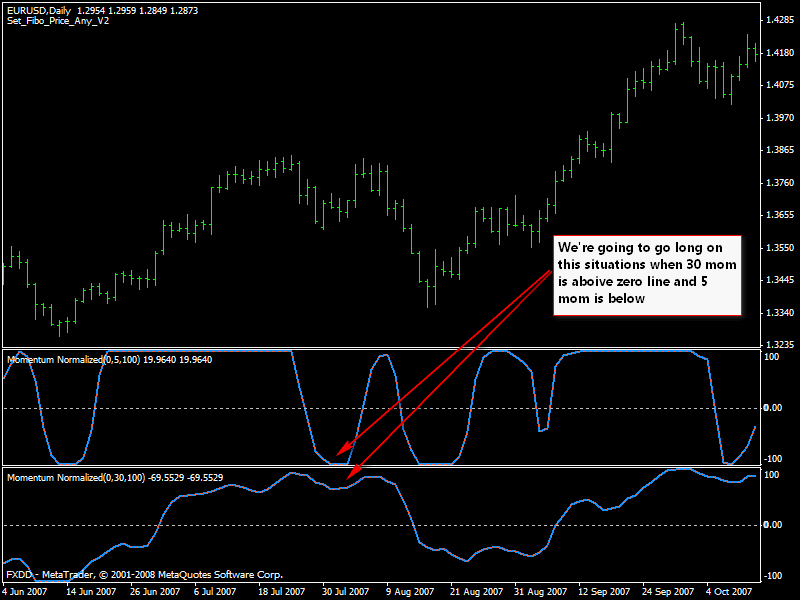
1. When the 30-day momentum is pointing up, go long when the five-day momentum is pointing down.
2. When the 30-day momentum is pointing down, go long when the five-day momentum is pointing up.
To download the only one needed indicator go here: https://www.mql5.com/en/forum/general
The recommended timeframe is dailies and the desired currency is the Euro.
Overall system idea: