These are today and last Friday trades.
It's very hard to explain this with posts and real time as we could do with LabTrend or Elite Follower because every trade explanation is not so simple and have many inputs to watch. Remember we are looking for momentum, price and time.
So, First days I will posts trades at the end of the day with detailed explanations.
The subject of this thread it's because we want to look beyond the simple breakout in with most systems are based.
We will not have 20 pips exit, we're going to have price projections here.
We will not have 20 pips stop, we're going to have moving stops here.
We will not just buy or sell when MACD cross, we're going to use MACD in the way that Gerald Appel recommends. And same with stochastic we're going to follow the master George Lane.
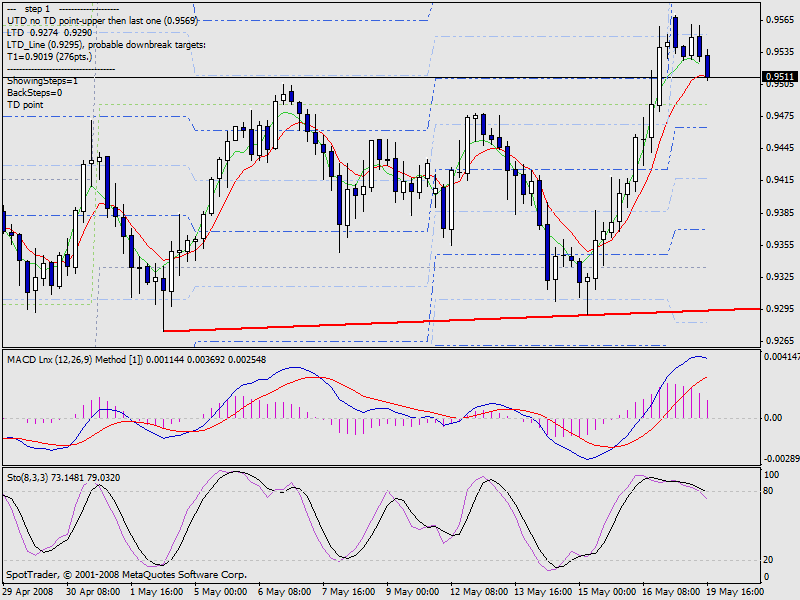
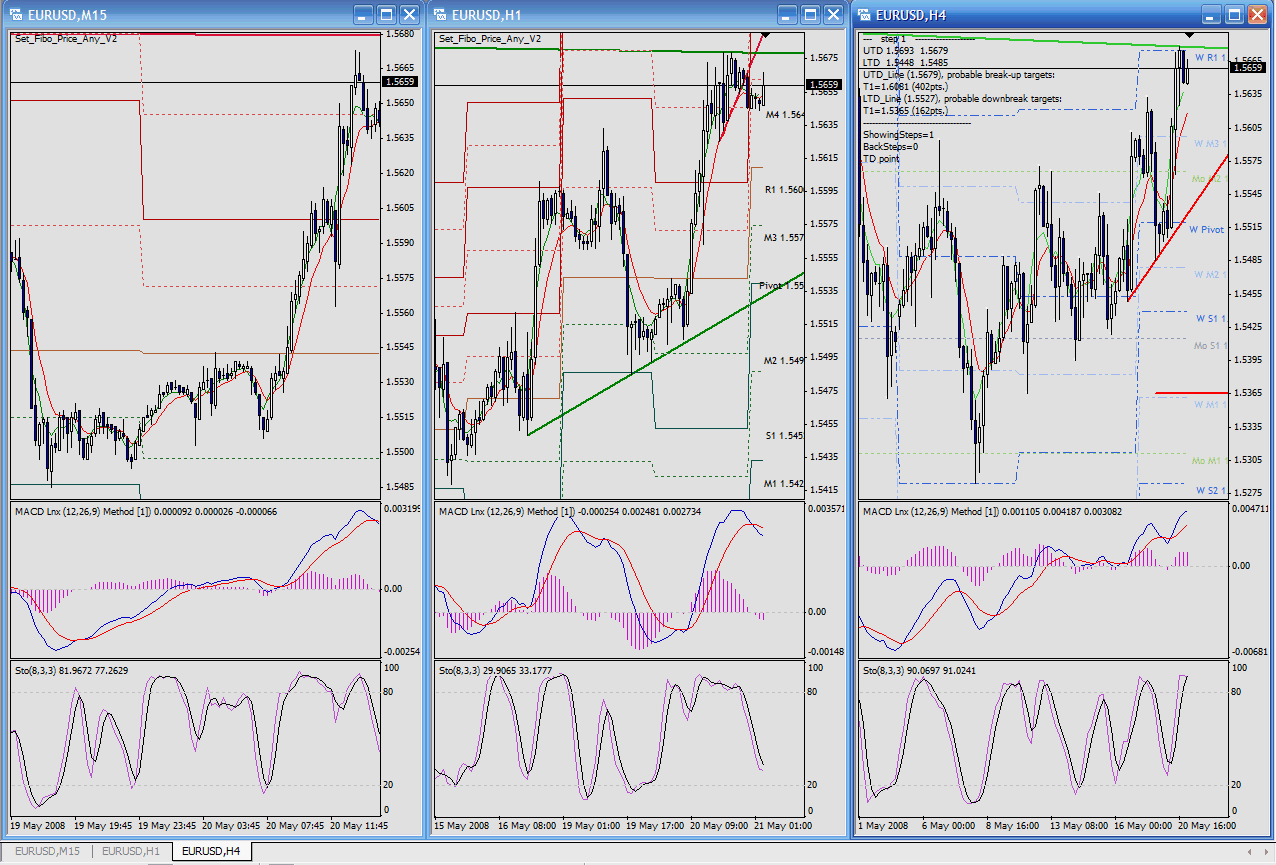
Lets's exam the Euro move.
Counter Trend trade.
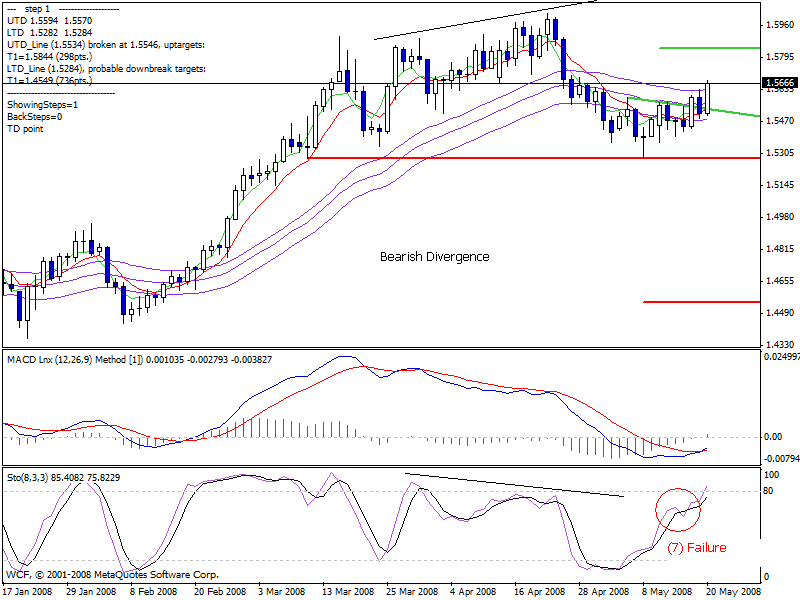
H4 Stochastic crossed and divergence. Trend couln't brake resistance and maybe is losing steam. So, our superior time frame is unbiased.

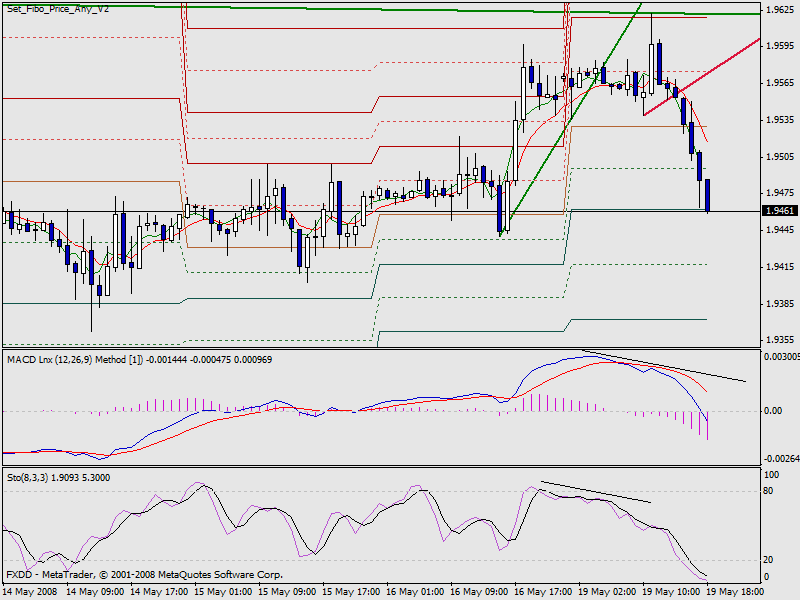
H1 is showing double divergence and we have an hourly trend line just broke. Fibonacci 50% and pivot point are at the same level. Also, pivot is the same as last higher high two days ago.

M15 have an impressive divergence on MACD. The hurly trandline was moved to this chart (crimson line) and the candlethat broker the trandline is at same level than lowers from previous session.
Enter agressive at next candle open (second candle after trenline break) and our target is the inverse H1 triangle, so if is 71 pips up it should be 71 pips down or S1.
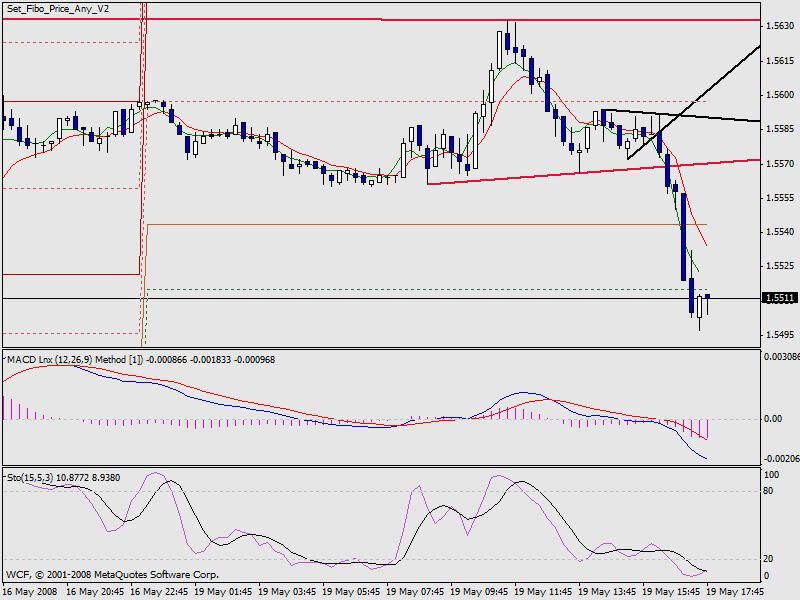
A close look to GBPUSD M15 show us how the pair is bounded within pivot point.

And the power of divergences.
Know your indies
George Lane is still trading Stochastic, he's 86
Gerald Appel wrote the MACD book later after the indicator was popularized but fortunately we have the words from the man who invented the indicator.
IMHO indcator are like my friends. But just stop to think about your life and your friend.
When you have 15 you have lot of friends and you know little about every of them.
When you have 40 you only have a couple but you know almost all about them, families, issues, wife.
Indicators are more or like, time past and you keep someone’s but you know too much about them than any others. Meanwhile at the begin of your trading you know many indicators but don't really know too much about each one.
Unfortunately Lane has never written a book about Stochastic and there is no to much data to read, just a few articles. We wrote something for TASC several years ago about stochastic and it's unbelievable how their words has been misunderstood.
First and same as RSI there is nothing about OB or OS conditions within Stochastic. It's a simple an pure momentum indicator thought to detect divergences and possible price exhaustion.
Also, Lane specified which Stochastic crosses are valid and which not. Some year later eSignal created eSignal stochastic signal.
Guess what is the magic behind eSignal? Just the correct interpretation about the explanation made by Lane.
How to Use Lane's Stochastics:
This method is based on the observation that as price decreases, the daily closes tend to accumulate ever closer to their extreme lows of the daily ange. Conversely, as price increases, the daily closes tend to accumulate ever closer to the extreme highs of the daily range. This concept also holds if you are working in either a weekly or monthly degree.
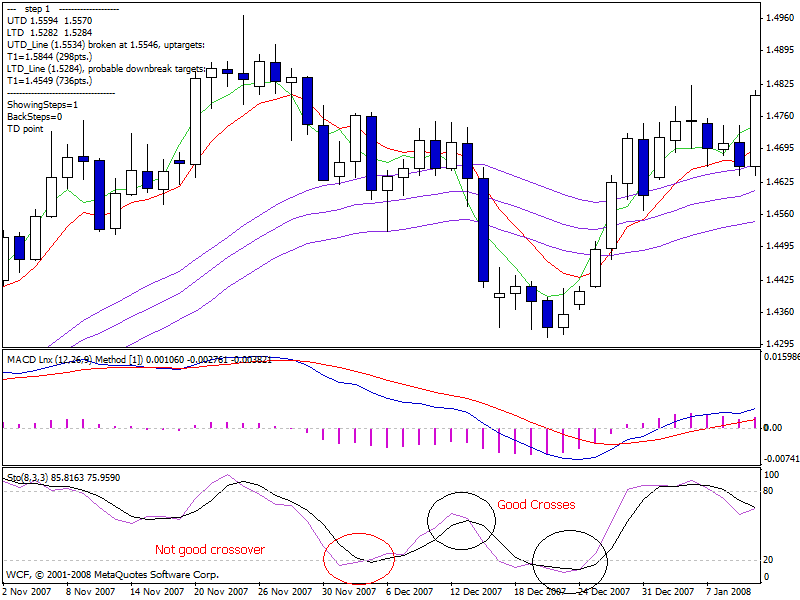
In working with %D it is important to remember that there is only ONE valid signal. That signal is a divergence between %D and the stock with which you are working.
All other signals are only guideposts, or warnings that an important signal is near. The following is a brief description of the various types of formations encountered on the %D chart. We have also provided small diagrams of graphic interest to illustrate the significance of each formation.
I. DIVERGENCE
As previously stated, this is the only signal which will cause you to buy or sell.
Briefly stated, when a stock has made a high, then reacts, and subsequently goes to a higher high, while the corresponding peaks on %D make a high then a lower high, a bearish divergence has been indicated. A sell signal is upon you.
Conversely, when a stock has made a low, then rallies and subsequently moves down to a lower low, while the corresponding low points of %D have made a low, and then a higher low, you have a bullish divergence.

II. TYPES OF CROSSOVER.
A right hand cross over is the most desirable.
III. HINGE.
A reduction in the velocity of movement in either "K" or "D" indicating a reverse of trend the next day.
IV. WARNING.
When the "K" line has been declining each day and then one day reverses sharply (from 2% - 12%) this is a warning that you have only one or two more days of downward movement before a reversal.
V. "K" REACHING THE EXTREMES OR 0% OR 100%.
When the "K" line declines to a value of "0" this does not denote an absolute bottom on the stock. On the contrary, it signifies a pronounced weakness.
IMPORTANT. After "K" initially reaches "0" it will rebound, usually to about 20% - 25% and then come back toward "0". It may not always reach "0" the second time, but should at least come close. (Your experience and observation will indicate closeness to you.) Normally, It will take from 2 days to 5 days
for "K" to come back this second time, depending on the velocity of the issue with which you are working.
The importance of it all is that you can DEPEND upon its coming back toward zero.
On the second time against "0" you can expect at least a minor rally to start.
The reverse of these rules apply at tops using 100%. As in the case of the low, expect a sell-off or correction after the second attempt at 100% by the "K" line. It must be remembered that 100% does not mean that the stock is as high as it can go, nor does 0% mean that we have reached the culmination of the
downward move - in fact, they mean just the opposite. You will have a reaction or hesitation at that level - then the resumption of the trend - of that degree - which is still in force.
VI. SET-UP.
This is another form of divergence. The primary function of this signal is to forewarn of a coming important top or bottom. If a corresponding low is made on a stock and on %D and then a swing to the upside occurs; IF on the sell-off the correction of the stock is normal (in proportion making a higher bottom) but %D falls to new lows exceeding its prior low - a bear divergence set-up is signified.
This means that the next swing up will probably provide an important top. The reverse of this holds true for tops.
VII. FAILURE.
When "K" has crossed up through the "D" line and then pulls back a few percentage points the next day, but fails to re-penetrate the "D" line on the downside, we call this a failure - and denotes strength or a continuation of upward progression. The same holds true on the downside.
Know your indies
What about Appel and MACD?
It’s hard to extract in a few phrases form the Appel’s book.
All about MACD and markets written there is lovely but these quotes could help:
• MACD represents the difference of the short-term exponential moving average minus the long-term exponential average.
• When market trends are improving, short-term averages will rise more quickly than long-term averages. MACD lines will turn up.
• When market trends are losing strength, shorter-term averages will tend to flatten, ultimately falling below longer-term averages if declines continue. MACD lines will fall below 0.
• Weakening trends are reflected in changes of direction of MACD readings, but clear trend reversals are not usually considered as confirmed until other indications (discussed shortly) take place.
During the course of price movements, short-term moving averages will move apart (diverge) and move together (converge) with longer-term moving averages—hence, the indicator name moving average convergence-divergence.
Although changes in MACD direction (from down to up, and vice versa) and crossings of MACD lines above and below 0 carry significance, crosses of MACD from below to above its signal line (an exponential average of MACD readings) and from above to below its signal line carry additional significance of their own.
As a general rule, crossings of MACD from below to above its signal line can be taken as confirmations of buy signals originally indicated when changes in direction have taken place in MACD from down to up.
The previous buy and sell signals are subject to further conditions, reviewed shortly. However, as a basic rule, reversals in the direction of MACD carry significance, which is confirmed when MACD crosses its signal lines.
Buy signals are much more reliable when the MACD has crossed from above to below 0 at some time since the most recent sell signal. The MACD does not have to be below 0 at the time of the buy signal, but it should have been below 0 at some time since the start of the recent decline.
• Sell signals are more reliable when the MACD has crossed from below to above 0 at some time since the most recent buy signal. The MACD does not have to be above 0 at the time of the sell signal, but it should have been above 0 at some time since the start of the most recent advance.
• During very strong market periods, usually during the early and best stages of bull markets, the MACD will retreat during market reactions to a level just above 0. In this case, you can shade the previous rules a bit as you might if the MACD tops out just below 0 during a bear market or severe intermediate decline. Most often, however, the 0 crossing condition should be respected.
And there is also a MACD pattern that I discovered incidentally and we would talk about later.
Notes about Triple Screen setup
This is extracted for the Book Trading for Living. Change the timeframes with your desired
magnitude shorter.
For example, if you want to carry a trade for several days or weeks, then
your intermediate timeframe will be defined by the daily charts. Weekly
charts are one order of magnitude longer, and they determine the long-term
timeframe. Hourly charts are one order of magnitude shorter, and they determinethe short-term timeframe.
Day-traders who hold their positions for less than an hour can use the
same principle. For them, a 10-minute chart may define the intermediate
timeframe, an hourly chart the long-term timeframe, and a 2-minute chart the short-term timeframe.
Triple Screen demands that you examine the long-term chart first. It
allows you to trade only in the direction of the tide- the trend on the longterm chart. It uses the waves that go against the tide for entering positions.
For example, daily declines create buying opportunities when the weekly
trend is up. Daily rallies provide shorting opportunities when the weekly
trend is down.
First Screen-Market Tide
Triple Screen begins by analyzing the long-term chart, one order of magnitude greater than the one you plan to trade. Most traders pay attention only to the daily charts, with everybody watching the same few months of data. If you begin by analyzing weekly charts, your perspective will be five times greater than that of your competitors.
A trader has three choices: buy, sell, or stand aside. The first screen of the Triple Screen trading system takes away one of those choices. It acts as a censor who permits you only to buy or stand aside during major uptrends. It allows you only to sell short or stand aside during major downtrends. You have to swim with the tide or stay out of the water.
Second Screen-Market Wave
The second screen identifies the wave that goes against the tide. When the weekly trend is up, daily declines point to buying opportunities. When the weekly trend is down, daily rallies point to shorting opportunities.
The second screen applies oscillators to the daily charts in order to identify
deviations from the weekly trend. Oscillators give buy signals when
markets decline and sell signals when markets rise. The second screen of the Triple Screen trading system allows you to take only those daily signals that point in the direction of the weekly trend.
Third Screen-lntraday Breakout
The first screen of the Triple Screen trading system identifies market tide on a weekly chart. The second screen identifies a wave that goes against that tide on a daily chart. The third screen identifies the ripples in the direction of the tide. It uses intraday price action to pinpoint entry points.
The third screen does not require a chart or an indicator. It is a technique
for entering the market after the first and second screens gave a signal to buy or sell short. The third screen is called a trailing buy-stop technique in
uptrends and a trailing sell-stop technique in downtrends
Proper money management is essential for successful trading. A disciplined
trader cuts his losses short and outperforms a loser who keeps hanging on
and hoping. The Triple Screen trading system calls for placing very tight
stops.
As soon as you buy, place a stop-loss order one tick below the low of the
trade day or the previous day, whichever is lower. Once you sell short, place a protective stop-loss one tick above the high of the trade day or the previous day, whichever is higher. Move your stop to a break-even level as soon as the market moves in your favor. Afterwards, the rule of thumb is to move your stop to protect approximately 50 percent of paper profits
The reason for using such tight stops is that Triple Screen trades only in
the direction of the tide. If a trade does not work out fast, it is a sign that
something is fundamentally changing below the surface of the market. Then
it is better to run fast. The first loss is the best loss-it allows you to reexamine the market from the safety of the sidelines.
We could do the same with a setup like D, H4, H1, or H1, H15, H5.
Sometimes we need to move to M5 to find better stop position minimizing our risk.
- Free trading apps
- Over 8,000 signals for copying
- Economic news for exploring financial markets
You agree to website policy and terms of use

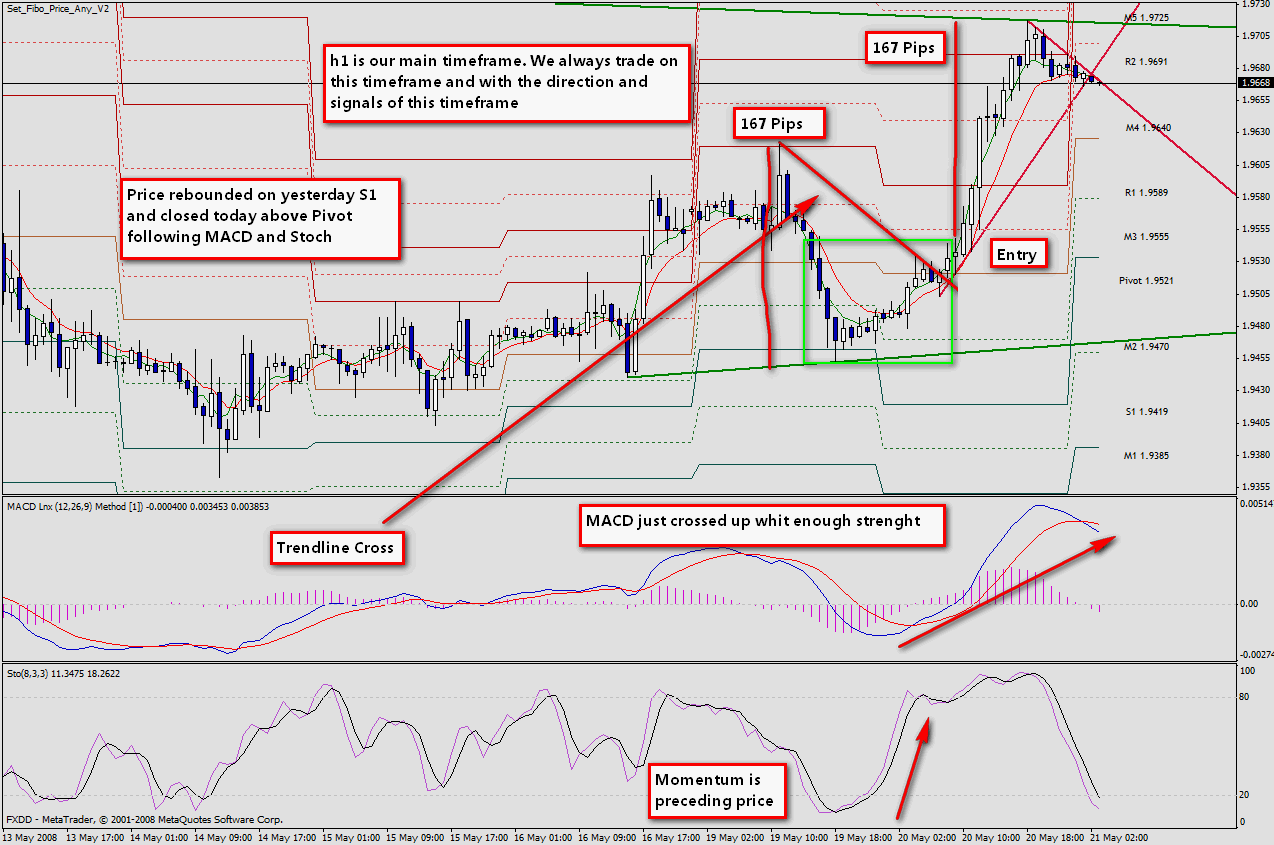
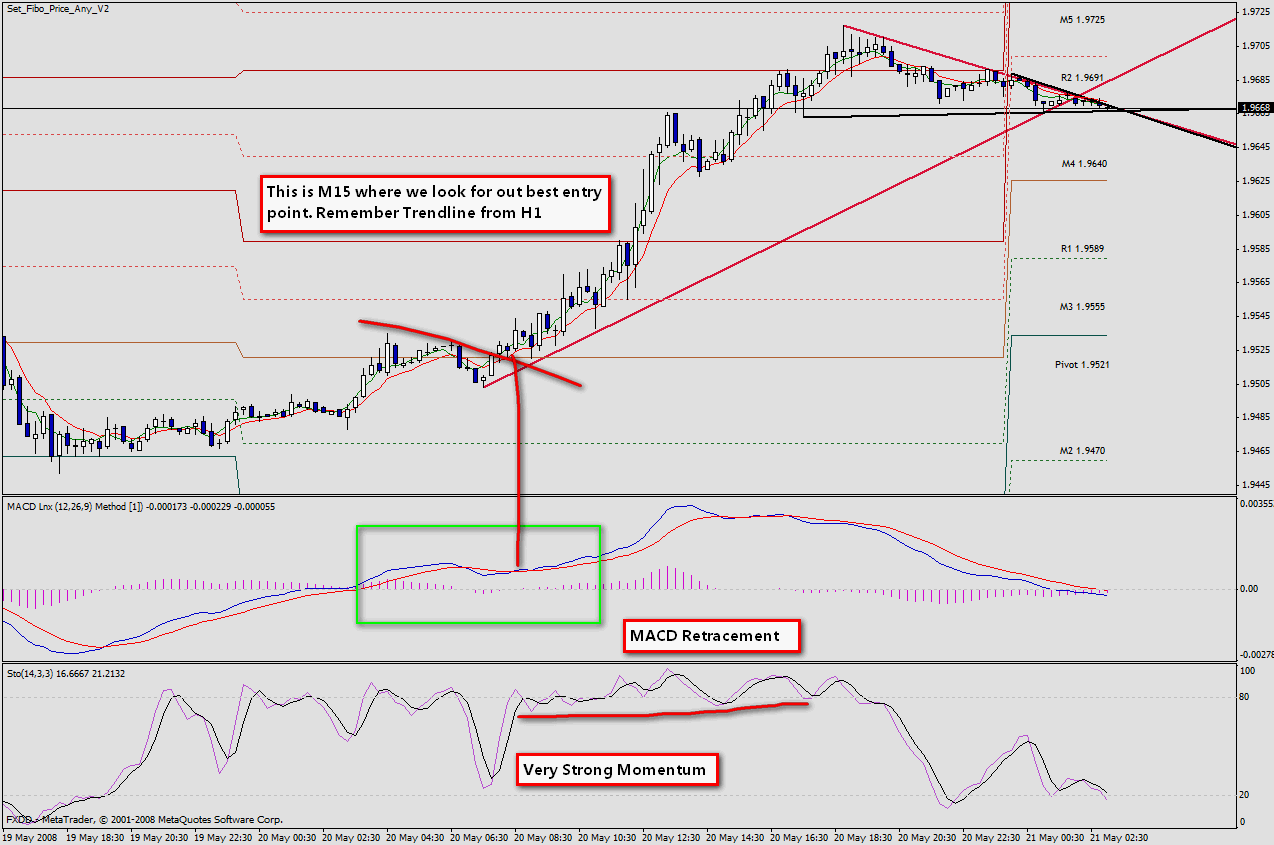
At this time we could start a thread about classical trading methods to traders with a bit of experience with the main goal of learning about trend trades and counter trend trades using classical indicators but gathering, momentum price and time.
To gather this three elements the triple screen setup developed by Elex Elder in the middle 80's it's our best approach.
This is the reason of last update to pivot indicators, ecuase we're going to use another tools like Fibonacci retraces and extensions.
Maybe some of you will think this is a very know system. And I could reply, yes maybe, but all posted here you could be find in old books because the wheel was already invented.
This trading would allow us to take trades as the following: