14MA/BrainTrend Sign/Barry Level
can u please post ur screenshot here... thanks.. 
ScreenShot
Thx for asking and showing interest! I made one, hoping that i havent put to much line and that it still obvious.
Here it is: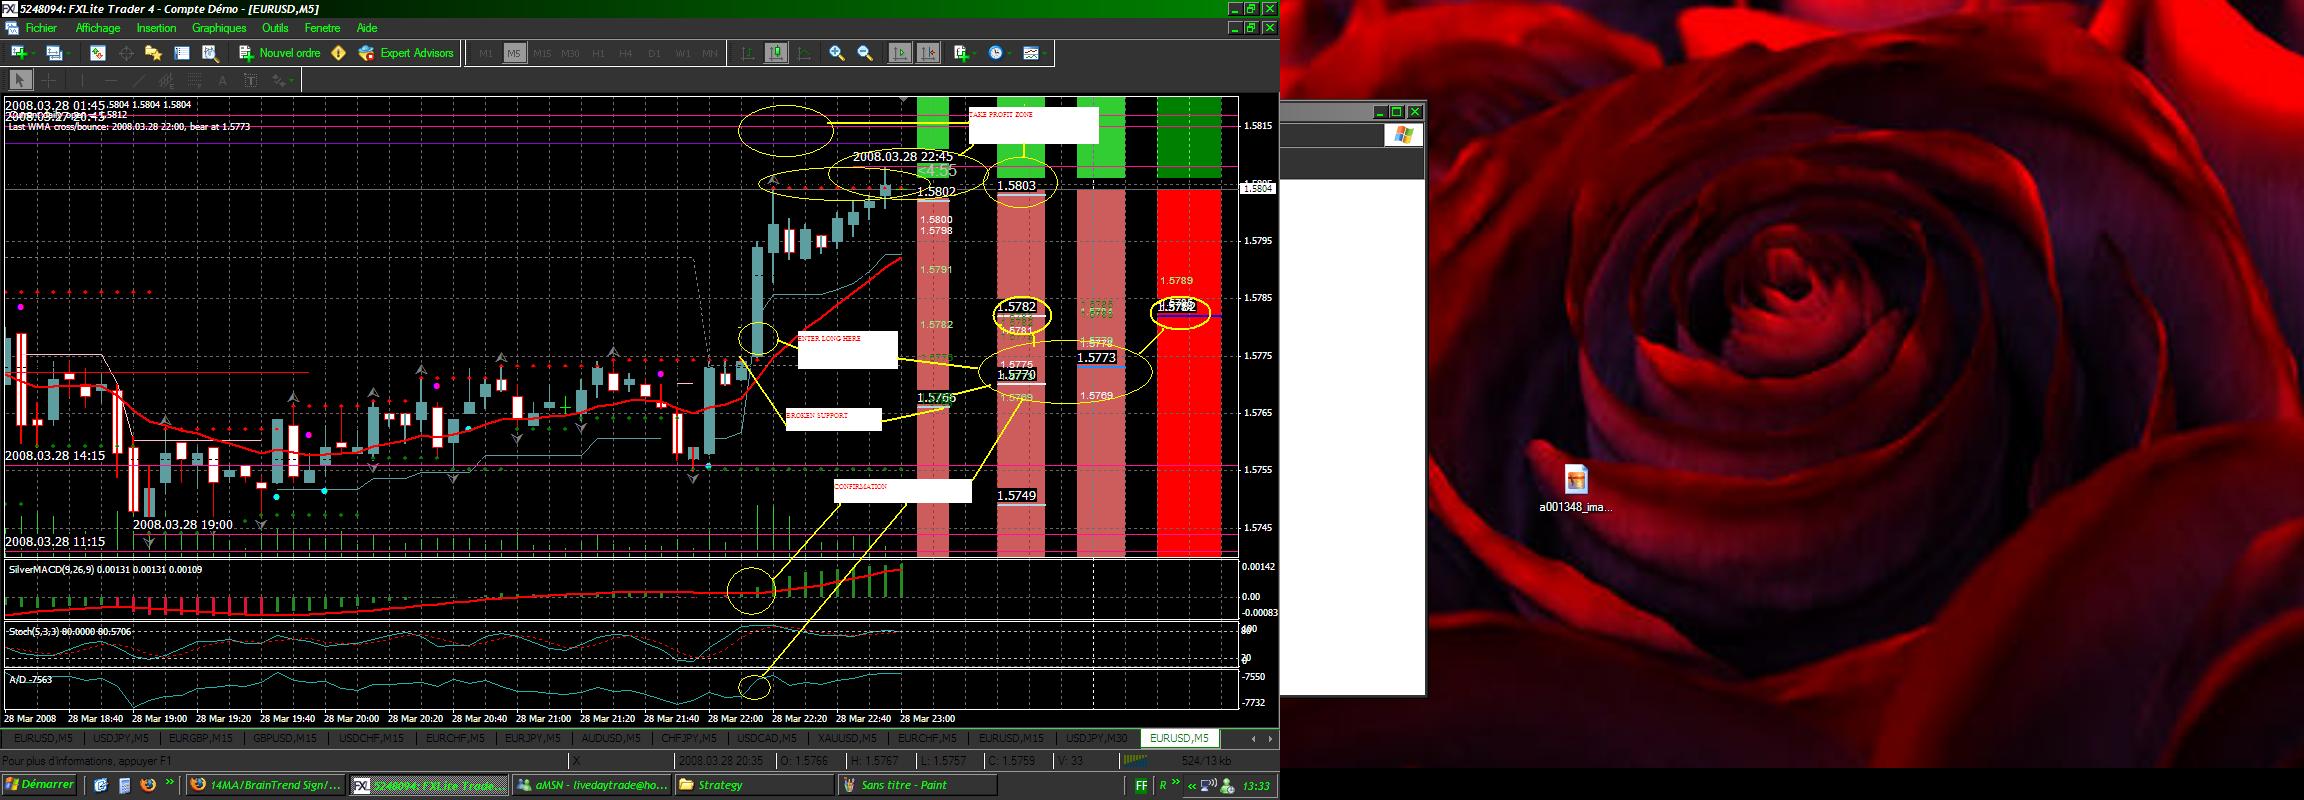
Stochastic and last 4hrs bars dosen't confirm on this exemple, but stochatic was in a run up (enter 80-100 zone) and last 3 bars (5min-15min-60min) were green.
Keeping in mind that its eur/usd getting to 1.5800 resistance.
So obviously here if price go up, it should hit next resistance,
witch was 1.58.02, then 1.5815 (been hit at end of US session, 20 min after this).
Support broken was 1.5770 and 1.5773, and 1.5782, after that only stop was 1.58.02.
I would close the position if price close under 14 MA, witch is my pivot point line (currency in a up or down trend if above or under).
Nothing of that is new, as 4_Period Ma system, or trend line sign vs 14 ma, but getting all those together make full sens for me, and seems to get good result til now.
Gemme Reply, more then welcome!
Another pics!
Here's another exemple of the tech: 
To resume:
1-Price have broke a Barry level, its under 14 MA, under (4/8P), just broke 3 time frame level (99.45 on 4hrs, 99.42 on 60min, 99.41 on 15min), last 4hrs bars is down, macd is down, stochastic havent crossed but picky, AD is down, its enough...
2-Big floor at 99.08, 99.07, fibs 23.6 and (-1/8P)
Stop loss would have been place at 99.45 as 4hrs last celling, 50 fibs and barry support.
Going for 2 or 3 lot, its a 20 pips trade.
----------------------------------------------
I know chart is noisy by MML, and stop line applied. I havent found MML that dosent make dot on the chart and i applied stopline just bc i like it! 
I also search for a Indicator that joint MACD and stochastic, i saw that somewhere but haven't found the file. Thx!
-----------------------------------------------
Comment plz!
Another one!
Here'sanother one:
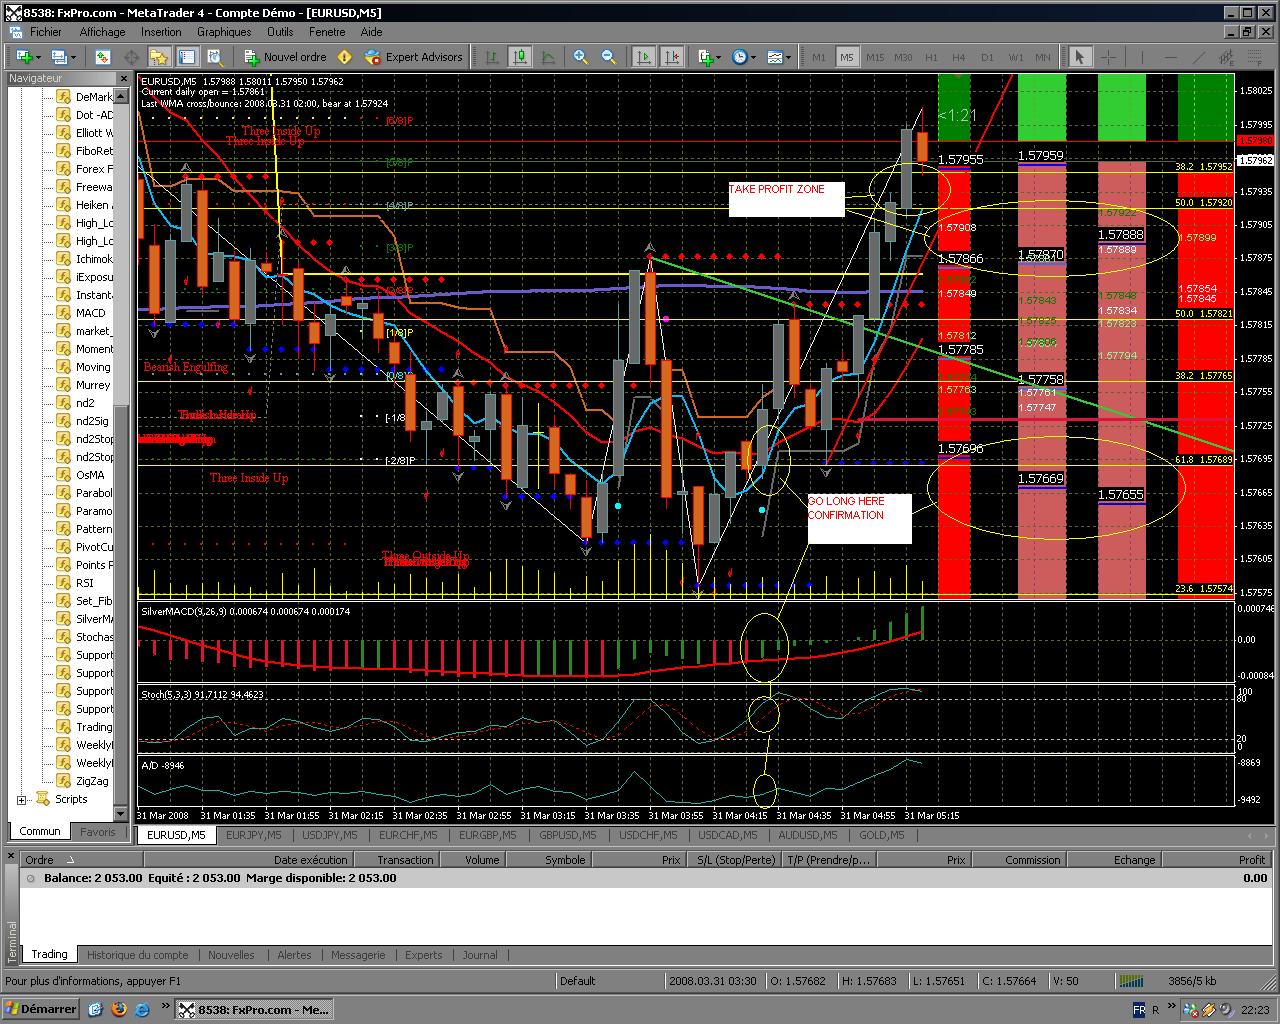
Ok, on the Hong Kong Open EUR/USD.
Look how price cross 14MA, is over some major support on 4PeriodMA, MACD is ending is run down, stochastic is running up, A/D also.
Enter 1.57740, I took profit at 1.57920 at 50.0 fibs for a 18 pips trade on 3 lots.
I know i said to take trade in the 4hrs 4_period_MA, but as my signature say, commen sens need to be apply. EUR/USD is going at 1.5800.... and 60min bar was green. As no barry support been broke.
Honnestly i got like 3 signal:
1-If price close over 14MA, and that will generate a trend sign.
2-If price close over a barry support or more risky, above last bar.
3-Price bounce back from 14MA after a correction, in a trend not laging market.
Im also looking at fibs to see if price crossed one, above or under.
All that confirm whit MACD and Stochastic and 4PMA support.
I will always close position at a Fibs level or MA on 4PMA or obvious correction.
Notice that price bounce at (-2/8) on 5 min chart, as it often do.
Since i play this method, let say around 8 on 10 trade is good.
Plz let me know what you think about my tech!!!
Waiting for reply! 
And .... another one!
Here we go again!!!
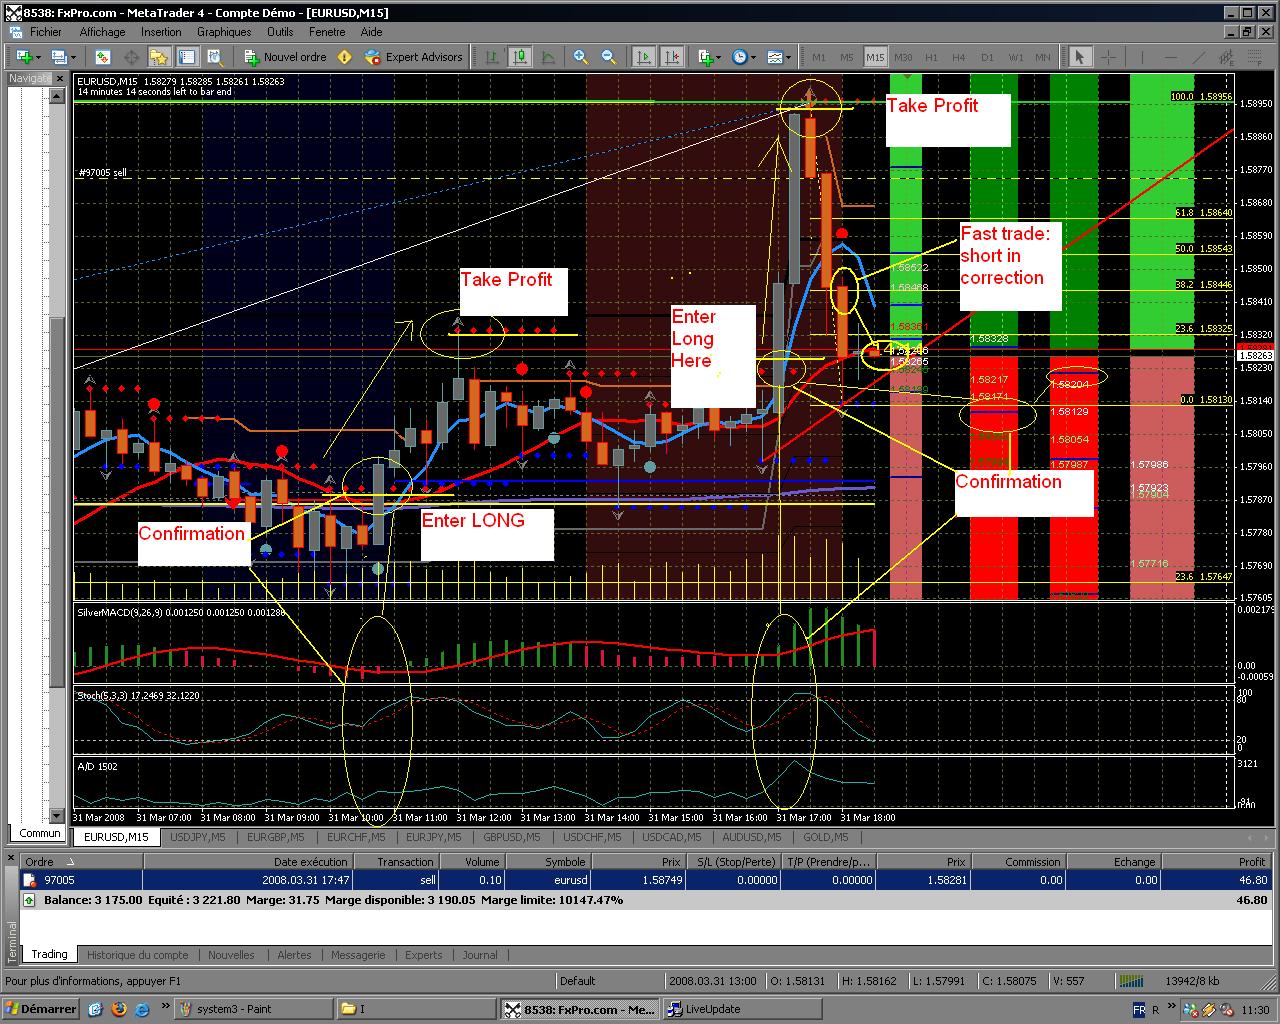
Ok, we got 3 trade on this one, have i said its "scalper" method ??! LOL
----------------------
TRADE #1:
ENTER AT 1.57960 (new candel over barry support) - MACD, Stoch and A\D match and some good support been broke on the 4_Period_MA.
EXITE AT: 1.58330, price is going down, stoc have crossed, A1D is down, support at 1.5804 on 4PMA.
= 43 tasty pips!
------------------
TRADE #2:
ENTER AT : 1.5825 when price cross barry support, MACD, sto and A\D confirm, support broke on 4PMA.
EXIT: 1.5890 when price is dropping down at the oppening of the second candel near 1.5900.
= 65 tasty fruity pips!
---------------------------------
TRADE #3: short correction
ENTER AT: 1.5844
EXIT AT: 1.5830 still going....
= 14 none less tasty pips.
-----------------------------------
As you can see my account have jump from 2053 to 3175$ and i made one stupid move anticipating the market. (Sometimes overconfidence is a real backstab knife!!!)
OK, ok, its demo im waiting a chek to start the real thing. But, as you can see, the tech is giving back some gooooood result. I'm so dreaming saying my Boss: BYE BYE!!! And its going to be soooooooooon!
I haven't saw any comments yet, i know i'm a fast typer but PLZ comment the sytem for any amilioration, some flower or even the pot. I would like some old timer here to give me feed back. OK pips are going in, but well, i can maby have some more!! HEHE!
I also applied " FOLLOW THE BOUNCING PIPS" from bear. That give me a better hestimation for long run trade. As i still got the #3 trade going for a amazing 89 pips!!! THX BEAR!!!!
Well, PLZ, comment!
Cheers all!
INZ!
Can you post your indicators, I could not locate all the indicators you use?
Indicators!
Can you post your indicators, I could not locate all the indicators you use?
Hi et_phonehome_2,
I'll but the basic of my system, most indicators are available on original MT4 platform.
Here are the research one:
4periodma.mq4 Those green and red line whit grid: MA and support inscrib.
braintrend1sig.mq4 Those dot that tell you when price cross 14MA
Seems im limited to 5 files so more on next thread!
Thanks for the files. I normally compile if I have the source else the ex4 files will have to do....
More Indicators!
[attach]58190[/attach] The barry are the blue or red dot that tell you last support.
[attach]58191[/attach]
[attach]58192[/attach] DeMark tell you when price broke a tendance.
I'm ain't sure if you need the .ex4, let me know.
For the nonlagzigzag and zigzagalert whatch this section on follow the bouncing pips of BIGBEAR.
If you need more info let me know. I also found a MurrayMathLine that dosen't make dot but line. Less noisy and that give good idea about long run.
----------------------
I strongly suggest to not use that system in a side market, only in a trend one, as opening or just after big moves. BrainTrendSign give wring signal on side market. If not 15 min chart can help but you can miss good opportnity. Depend if you are day trading or swing.
----------------------
As i said PLZ leave me comments. Even if its HI!!! LOL.
Almost 300 hits here no comments. Is it good or not, hehe!
If any of you use same or "kind of" system let me know, if any one tried it and got comments or need detail, let me know.
Well, hope it help, gemme opinion on the thing!
Thanks for the files. I normally compile if I have the source else the ex4 files will have to do....
A1, thx to let me know.
Tell me how it goes!
- Free trading apps
- Over 8,000 signals for copying
- Economic news for exploring financial markets
You agree to website policy and terms of use
Tech:
Go Long when price break a barry level whit MACD and stochatic in the way of the trend, not in reveral zone (80-100).
Go Short when price break a barry level whit Macd and stochastic in the way of the trend, not in reversal zone (20-0)
Get out at next fibs or price hesitation.
--------------------------------------------------------
4 period MA help to know if last 5, 15, 60 min and 4hrs were up or down. If Light Green, been up for last x min. If fade = neutral. If Light Red = up for last x min, if fade = netral. All lines on the Grid are resistance and support. Helping to know where the pairs run will end- 5 min support are not major, 4hrs and 60 min are! When all 3 are same color, we got a nice sign. If 4hrs is in the way of the trade but not those 3 first, its still a nice sign. (murrey math lie can help there to know where the correction is at right now, looking for rebounce.
---------------------------------------------------------
Please, feel free to comment "my" system. Any amilioration or weekness, let me know. Nothing is perfect.