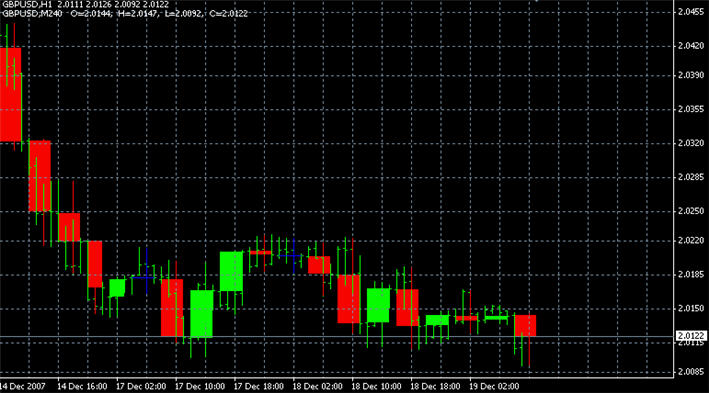
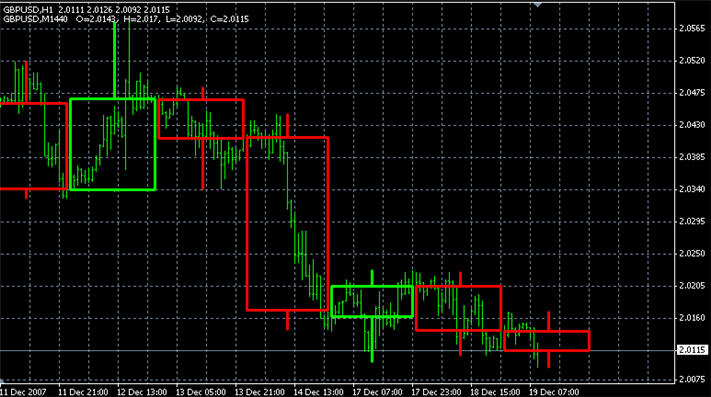
Understanding Multiple Timeframes How They Build Each Other
Zoom out of the smaller time frame, and it will look like the longer time frames.
hi
that's right smaller time frame build larger time frame ...for simple a helicopter view ..you can't see a detail from a higher altitude ..but if you're going down you can see what's exactly happen there
===================
I understand what you guys are trying to say but my problem is trying to decipher what the smaller timeframes are telling me.
Excatly how do you folks know when a big move is about to happen??
Eg. if im looking at a 15 minute chart what am i supposed to be looking for to reconize that the 1hr 4 hr or even daily chart is going to have a upward or downward move.
Again I am a visual learner, but I am staring at something that I really dont understand so put in a nutshell I'm looking at charts but not comprehending them.
Is there any good examples that I can look at?
one again thanks for all of the help.
Helicopter View.
that's right smaller time frame build larger time frame ...for simple a helicopter view ..you can't see a detail from a higher altitude ..but if you're going down you can see what's exactly happen there
===================
Forex Indicators CollectionThanks for starting the new thread WishfulPIPing. I have asked this question at tsd before but got no answer. Is there a way to zoom out futher on mt4 then the stock set up. May be two more steps back. To get the helicopter view as praswx says.
I think you should always get the big picture before entering a trade. Zooming out also help to see how the higher time frames build.
Jatki24300
You are asking the 64k question. How do you know what to look for (on any timeframe) to tell you that a move is about to happen? It all depends on the trader and what method he is using. Some people look for candlestick patterns, some people look for R/S levels, some people look for MACD...at the end of the day, there is no 1 right method. You just gotta decide for yourself. Most people look at the higher timeframe, decide that they like what they see, then move onto the lower timeframe to find the perfect entry spot by using overbought/oversold indicators, but they already made up their mind to buy or see on the higher timeframe.
Can someone please explain to me or direct me to somewhere where I can visually see (to understand) How The Smaller Time Frames Build The Larger Time Frames.
I hear alot of people talking about catching the larger moves by looking at smaller timeframes and what they are doing because they build the larger timeframes.
I tried to study them buit I can not seem to grasp the concept of how they can reconize the move.
I'v been reading up on this subject but I cannot visualy see it on a chart so if someone knows of a good place to see this on actual charts please let me know.
Thanks a bunch.
AldenHere is Thread which you might find usefull.
on 5min chart..you are watching Simple moving average till 4Hour chart.
- Free trading apps
- Over 8,000 signals for copying
- Economic news for exploring financial markets
You agree to website policy and terms of use
Can someone please explain to me or direct me to somewhere where I can visually see (to understand) How The Smaller Time Frames Build The Larger Time Frames.
I hear alot of people talking about catching the larger moves by looking at smaller timeframes and what they are doing because they build the larger timeframes.
I tried to study them buit I can not seem to grasp the concept of how they can reconize the move.
I'v been reading up on this subject but I cannot visualy see it on a chart so if someone knows of a good place to see this on actual charts please let me know.
Thanks a bunch.
Alden