2 pair one chart? - page 6
You are missing trading opportunities:
- Free trading apps
- Over 8,000 signals for copying
- Economic news for exploring financial markets
Registration
Log in
You agree to website policy and terms of use
If you do not have an account, please register
is there one with mirroring function? thx in advance.
Other symbol on the main chart. othersymbolonchart.mq4
In order to compare two different period price lines (Monthly and Weekly instead of symbols) , is there any similar overlay chart indicator that can print multiple price lines (or channels) based on the input of different chart periods so that multi-year changes can be detected .
In order to compare two different period price lines (Monthly and Weekly instead of symbols) , is there any similar overlay chart indicator that can print multiple price lines (or channels) based on the input of different chart periods so that multi-year changes can be detected .
Compressing data to the same chart is never going to produce a comparable output (since the time of one value does not correspond to the time of the other value at all). Instead, usually people are using multi time frame indicators for that pusrpose
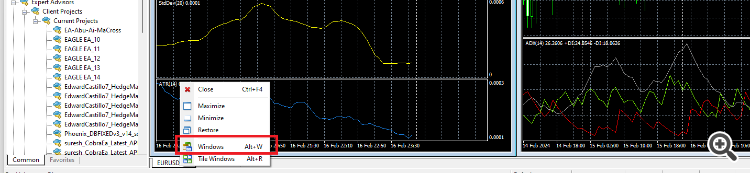
why you need to open it in same chart when you can open it in same window like this. If comparing between two is the only goal ,they why we are making it so difficult , here is the same how I open two chart in a same window
open only two chart from marketwatch and click on this button
it will make the screen split
Click on any window and change the parameters in that window , like timeframe ,indicator settings , drawings bla bla
if we want to toggle to default window style