RSI ADX Stochastic
Post reserved for future updates.
Another post reserved for future updates.
Okay lets make it a bit more clear. I'd like to write 2 systems.
1.
For small moves on small timeframe during active market hours.
2.
For huge moves on higher timeframes to catch long trends.
For that I will most likely use 3 indicators that I named and I may also look for more to filter signals or add features.
On the long timeframes I plan to add profitable positions while the trend is moving - like add breakouts on retraces.
On short timeframes I want to catch parts of those retraces and get little profit each time.
But I need a system. Thats why I'm asking for help. Do you know any good settings for the 3 indicators that will allow identification of trend or trend reversal?
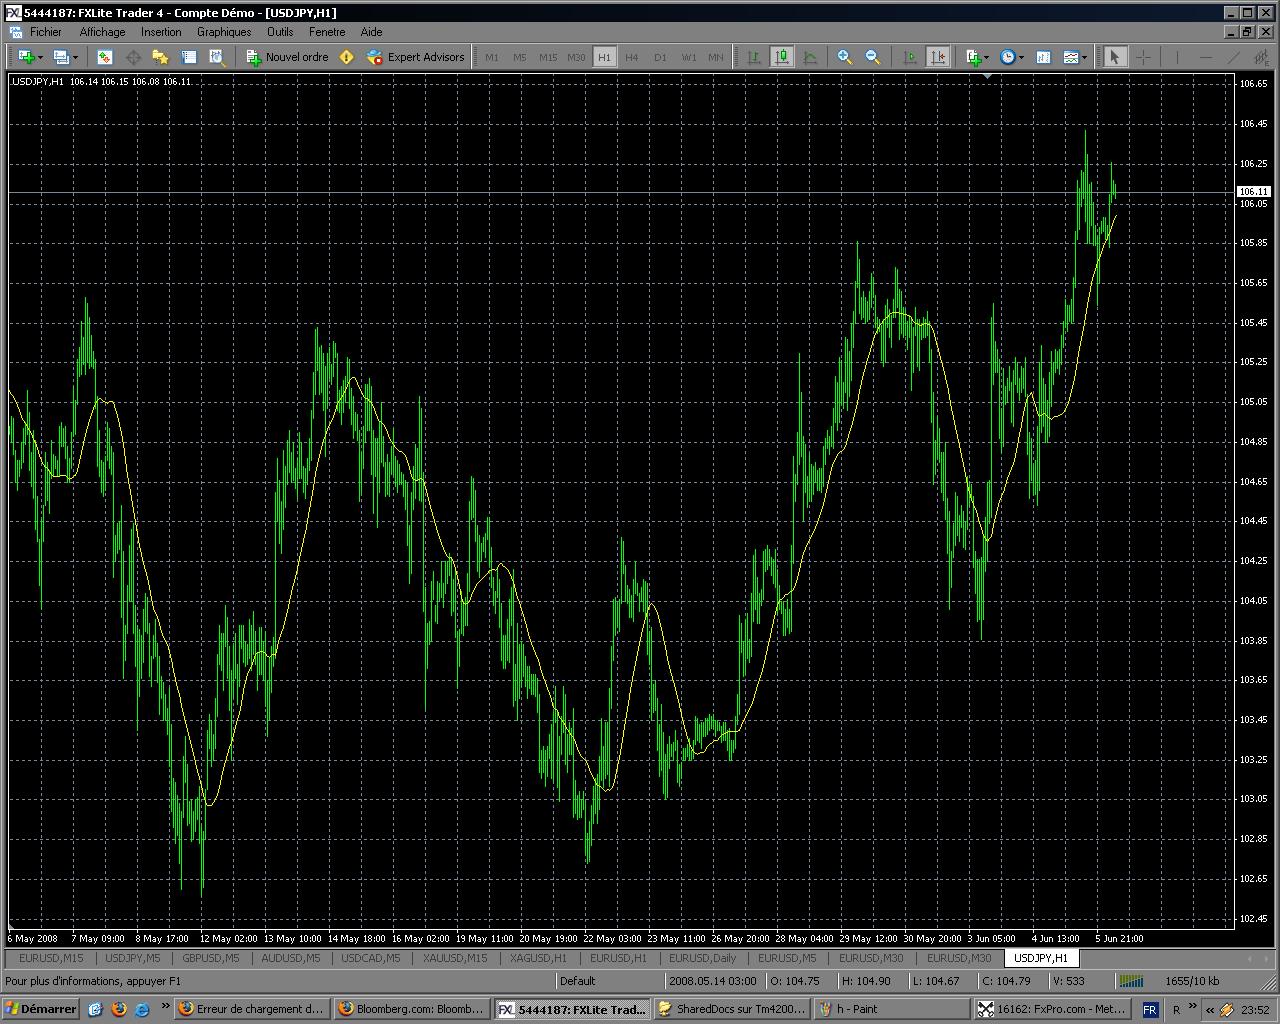
I'm posting an example. There is a trend reversal for H1 (I'll add a pic from H4 later). I'd like to enter a trade on daily pivot or a signal from indicators or any reason. Then I'll add positions on retraces. Not buy low, but add buy-stops once a new low is made. I used ZigZag because it helps identify levels.
Since I know GBP/USD better than EUR/USD, I checked few more indicators and made few positions.
So far I only see that you can buy when stoch shows oversold in an uptrend (keep buying!!!). But only if the trend is strong. I don't know how to get an idea of the trend's strength other than from Heiken-Ashi but I'm not using it at the moment.
I'm attaching picture where I added some new indicators but the most interesting ones are:
Moving average built on Highs, period 5, shift 1,
Moving average built on Lows, period 5, shift 1,
Moving average build on Close, period 8, shift 8.
I noticed that when High breaks Close (both the price and High MA break through Close MA) you can buy. I already opened a position on sell because of that. I also added a position based on ZigZag and got a bad result. Don't put stop orders under or over the last ZigZag's move. It re-draws its last move. Only put stop orders over/under before-last and previous moves.
See picture for details!
Black arrows - one shows small blue circle, one shows green circle. The green one gave a better signal, the blue one shows awful signal.
I opened a trade for these reasons:
Price got lower than low MA and both low MA and price were lower than close MA. Price got lower than the last ZigZag lows (which were going higher and higher) which should mean that the most recent up-trend is ending.
The first (good) sell is in +, the second (bad) sell is in -.
I plan to put more orders as long as there are signals either until 30% of margin is used or till orders start covering their cost (100 pips usually covers a position's margin with profit).
If you get any questions, ask!
If you have any ideas on these or other indicators that give good signals, put them here. I'll be making an EA soon so we can check it all.
I made a small calculation. If you bought on Stoch's 22's during last up-trend on gbp/usd with 5% per position, you would have doubled your account by now. More than 2500 pips made. If you add breakouts on Zig-Zag that makes up another 900 pips or so. Total result should be 150% with 5% per position. 15 positions or so. And no, that would not be 75% of margin, it would be around 30% margin. 5% per position takes 5% margin. 2,5% if you use IBFX and 200:1 leverage. 2,5*15 = 37,5% - profits. Profit of 3000+ pips means positions covered their margin completely. So you would most likely never have more than 20-25% margin.
Those are not precise calculations, they are approximate. Only last trend is being analyzed.
Anyone willing to help build this system?
I only need help finding good parameters and good indicators to be used in the system. I do not need help with coding at this moment.
hi
I made a small calculation. If you bought on Stoch's 22's during last up-trend on gbp/usd with 5% per position, you would have doubled your account by now. More than 2500 pips made. If you add breakouts on Zig-Zag that makes up another 900 pips or so. Total result should be 150% with 5% per position. 15 positions or so. And no, that would not be 75% of margin, it would be around 30% margin. 5% per position takes 5% margin. 2,5% if you use IBFX and 200:1 leverage. 2,5*15 = 37,5% - profits. Profit of 3000+ pips means positions covered their margin completely. So you would most likely never have more than 20-25% margin.
Those are not precise calculations, they are approximate. Only last trend is being analyzed.
Anyone willing to help build this system?
I only need help finding good parameters and good indicators to be used in the system. I do not need help with coding at this moment.that's good system...zig zag ca be more accurate if you know how the trend made ....just watch on second last leg from zigzag to determine price direction.
===================
I've noticed that putting zigzag's depth (first parameter) to 50 gives us a nice picture! Good to determine current trend. But I can't make zigzag get over all other indicators (so its not covered by any other ones). Any ideas?
I'll upload a picture so you can see it better.
You can see zigzag with extdev set to 50 and pivot lines (the straight ones). The chart is whitened out by 30_candles_Shinigami indicator. If you want to use any other background color, just change the color of the indicator to match background color. Use 1000 value - this covers all bars up to MN.
I uploaded the indicator and the template.
Hi everyone!
I made a small discovery with Stochastic. I was going to sell whenever it went overbought and started falling, and buy when it went oversold and started rising.
But I made a (maybe small for you, but big for me) discovery.
The discovery - when we get overbought, we are more likely to rise in the longer term, and when we get oversold, we are more likely to fall in the longer term.
So with overbought and oversold areas we are more likely to continue our movement.
BUT!
There are times it works perfectly opposite. When we get overbought, we are most likely to fall, and when we get oversold, we are most likely to rise.
You all know the difference. Its either trending or ranging.
Why am I so certain? Because I get win streaks of up to 23 for trending periods and losing streaks of up to 36 for ranging periods. The EA is set to work with trending (following Over-areas).
So now I only have 1 question left.
How do you determine if its trending or ranging?
Answering that question might turn the EA into a total winner. Current condition is horrible - 5200 pips for 3 years and 2200 relative drawdown. Usually it has long win streaks followed by long lose streaks. If there was a way to determine the point when we need to switch from ranging to trending and back, it could make 10 000 or more pips during those 3 years. So, anyone got a good idea to try out?
any update on t indicator??
I have a nice indicator template...and can try to put the rules in it...and it can produce a indicator by itself...
interested?
sonic
- Free trading apps
- Over 8,000 signals for copying
- Economic news for exploring financial markets
You agree to website policy and terms of use
Hi! I've been searching the forum for such setups, EAs, systems but it only showed "no result" so I'm starting this thread.
I think we can make a system that would use
RSI ADX Stochastic
indicators in order to trade.
I'm sorry if there is a thread to use this trio already, just drop me a link because I didn't find it.
I think of making 2 systems that would trade on a low (M1 or M5 or M15) and a high (H1) timeframe. Low TF system would have a small TP and higher TF should have a higher TP and generate large profits.
Since I'm new to indicators and their meanings usage ect, I'd love if people here helped me. You know much more than I do.
Lets start with what I know.
RSI = relative strength index. The only thing I know of it is that if RSI and price make a divergence, you can expect a reversal.
ADX = Average Directional Movement Index. No idea.
Stochastic = Stochastic oscillator shows overbought-oversold areas. Doesn't give a signal as is but gives a general idea where we are and when to expect a possible reversal (after reaching 20/80? or 30/70?).
We can add Parabolic Stop And Reverse (PSAR). No idea how to use it though.
As for profits we can use Fibo levels for TP. Or we can use them to move to BE or move stoploss to a lower level when a higher level is reached.
Yep, I have a lot of things to learn. But that is why I'm asking for help - otherwise I'd simply write an EA myself.
What I need help with is the strategy. I want help in creating it.
Anyone willing to help?