LSMA and EMA with angle ?
LSMA and EMA Angle view
I am not sure what you are asking for here.
I will be starting a new thread for LSMA EA shortly and will be posting lsma, lsma angle, ema angle and other lsma related indicators as well as an EA based on LSMA.
Robert
LSMA with Angle Reading
Fran, just like you, I'd love to get a reading on the angle of my LSMA in degrees. Unfortunately it appears that coding is somewhat challenging. If you find the indic that shows the LSMA and EMA angles in the pic you posted, please share it.
And Mr. Pip, maybe you'd be "pulled" in by the angle-coding challenge. Also I like your LSMA thread; keep it going.
Happy trading all!
jr
MA Angle indicator
Fran, just like you, I'd love to get a reading on the angle of my LSMA in degrees. Unfortunately it appears that coding is somewhat challenging. If you find the indic that shows the LSMA and EMA angles in the pic you posted, please share it.
And Mr. Pip, maybe you'd be "pulled" in by the angle-coding challenge. Also I like your LSMA thread; keep it going.
Happy trading all!
jrI have alreaqdy been working on the MA Angle code. The problem is similar to the old days of aspect ratio for different screen resolutions. The biggest issue is that the x axis is constant whille the Y axis has different movements based on timeframe. What might be needed is to use minutes as a base for X and pips for the Y axis and calculate everything based on that. I have been very busy with writing EAs and will get back to this problem when time allows.
Robert
I have alreaqdy been working on the MA Angle code. The problem is similar to the old days of aspect ratio for different screen resolutions. The biggest issue is that the x axis is constant whille the Y axis has different movements based on timeframe. What might be needed is to use minutes as a base for X and pips for the Y axis and calculate everything based on that. I have been very busy with writing EAs and will get back to this problem when time allows. Robert
Don't use angles, use slopes instead (pips per minutes), it's far easier as you do not have to fight against the zoom, timeframe change, axe's scales etc of the chart representation. Angles are not at all an absolut concept as slopes are.
Chart setup template and indicators
Hi Frantacech,
Your charts on the first post are by far the neareast I have seen to trading woodie's CCI system nice job.
Would you share your template and indicators with me/us ?
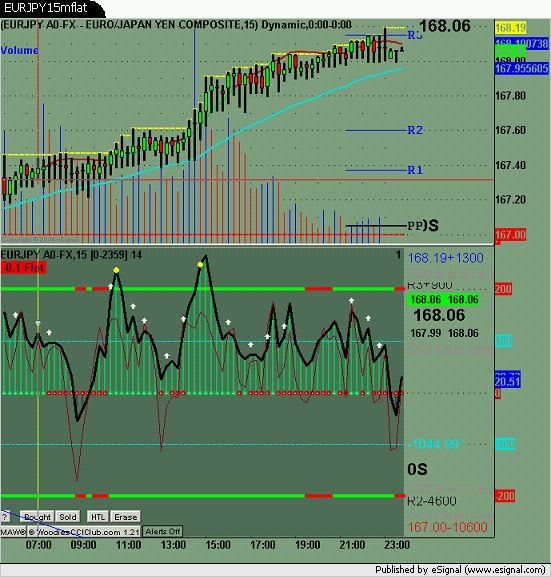
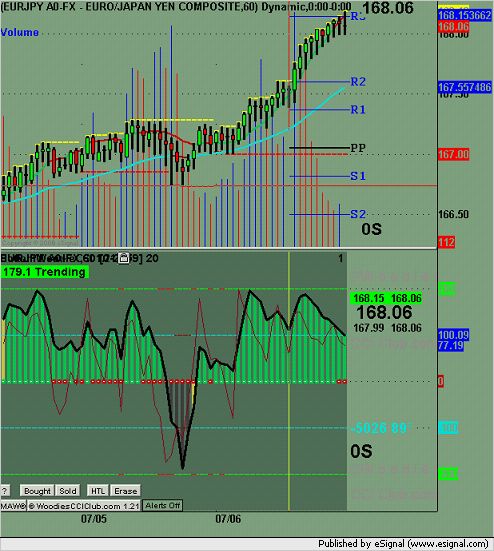
I'm running woodie's version on Esignal and the code is password protected  but the angles of the MA averages you are looking for are actually just used to state if the market is flat, trending up or trending down have a look at the upper left of the charts posted
CU
LSMA with angle
Hi all,
I could be wrong but I believe I saw a MA indicator with the angle in degrees made by Fx_Sniper. You could try and PM him and ask him. I did a quick search but couldnt find it.
MA Angle
Don't use angles, use slopes instead (pips per minutes), it's far easier as you do not have to fight against the zoom, timeframe change, axe's scales etc of the chart representation. Angles are not at all an absolut concept as slopes are.
Angles are basically using a trig function (MathArcTan) to convert slope(DeltaY / DeltaX) to angle in radians or degrees. The problem still remains. I modified using pips per minute and still find the same problem as before. When moving out to higher timeframes the range of values decreases at each step.
On GBPUSD the ranges are
1 minute 1.4 to -1.5
5 minute 0.47 to -0.61
15 minute 0.20 to -0.21
30 minute 0.13 to -0.10
60 minute 0.12 to -0.15
240 minute 0.05 to -0.07
1440 minute 0.03 to -0.03
Robert
Angles are basically using a trig function (MathArcTan) to convert slope(DeltaY / DeltaX) to angle in radians or degrees. The problem still remains. I modified using pips per minute and still find the same problem as before. When moving out to higher timeframes the range of values decreases at each step.
On GBPUSD the ranges are
1 minute 1.4 to -1.5
5 minute 0.47 to -0.61
15 minute 0.20 to -0.21
30 minute 0.13 to -0.10
60 minute 0.12 to -0.15
240 minute 0.05 to -0.07
1440 minute 0.03 to -0.03
RobertI think you did a mistake : changing TF, you change the time unit, so what you obtain is DeltaY/(DeltaX*Period()).
You should just have to compute DeltaY/DeltaX where DeltaX is in minutes, not in period; then TF doesn't matter.
I think you did a mistake : changing TF, you change the time unit, so what you obtain is DeltaY/(DeltaX*Period()). You should just have to compute DeltaY/DeltaX where DeltaX is in minutes, not in period; then TF doesn't matter.
The original method used deltaX as the number of bars on the X axis which is a constant. This would give pips/bar.
The code I use for deltaX is as follows.
deltaX = (PrevMAShift-CurMAShift) * Period();
PrevMAShift defaults to 4, CurMAShift defaults to 0 so there are 4 bars on X axis( the original deltaX). This is multiplied by Period() to get minutes. On 1 minute chart period is 1 so 4 bars are 4 minutes, on 5 minute chart Period is 5 so 4 bars are 20 minutes.
So timeframe does matter for calculation of minutes from the number of bars.
For deltaY the code is
deltaY = (fCurMA - fPrevMA) / Point; // deltaY in Pips
Then slope as pips/minute is
fAngle = deltaY/ deltaX; // slope
It is possible the slope is different for each timeframe because it just is. This might mean determining a different slope threshold in each timeframe for determining flat markets.
I think visually determining slope is the problem. When the Y axis is reduced to include the same price range on each timeframe the slope does appear different.
In case you did not know this I have a degree in Computer Science, Computer Engineering and a minor in Mathematics as well as over 30 years of programming experience. Before that I was a mathematical analyst for several years.
Robert
- Free trading apps
- Over 8,000 signals for copying
- Economic news for exploring financial markets
You agree to website policy and terms of use
Hello everybody?
I need LSMA and EMA indy with angle view.
Please, exist?
It is https://c.mql5.com/forextsd/forum/10/snipersw.gif