VT to MT4 ?
If you zip it you can attach it (7 zip works good).
If you zip it you can attach it (7 zip works good).
Thanks for reminding me of that Rich -- yes 7 zip works good
Thanks
Thanks for reminding me of that Rich -- yes 7 zip works good Thanks
Can't wait to see this indicator in MT4. Any coder gurus.......out there......thanks
I'm not very good at converting code, otherwise I would try this. This looks like a very interesting indicator though, would be great if someone capable could convert this to MT4.
Rupp
Can you give the code of indicator in txt format?
I have attached the BB squeeze in MT4 format:
Here is the VT Bollinger Bands Squeeze Indicator formula :
ATR1:= ATR(Length);
SDev:=stdev(Price, Length);
BBS_Ind:= (nBB * SDev) / (nK * ATR1);
BBS_Indup:=if(BBS_Ind>sql,BBS_Ind,null);
BBS_Inddw:=if(BBS_Ind<sql,BBS_Ind,null);
{-- Plot delta of price from Donchina mid line ----------}
value2:= linreg(price-((HHV(H, Length)+LLV(L, Length))/2
+
Mov(C,Length,E))/2,Length);
setColhissup:=if(value2>0,value2,null);
setColhissdw:=if(value2<0,value2,null);
===========================
(sql is Squeeze Line level (float))
Thanks so much Rich for posting the code and thank you Igorad for asking --
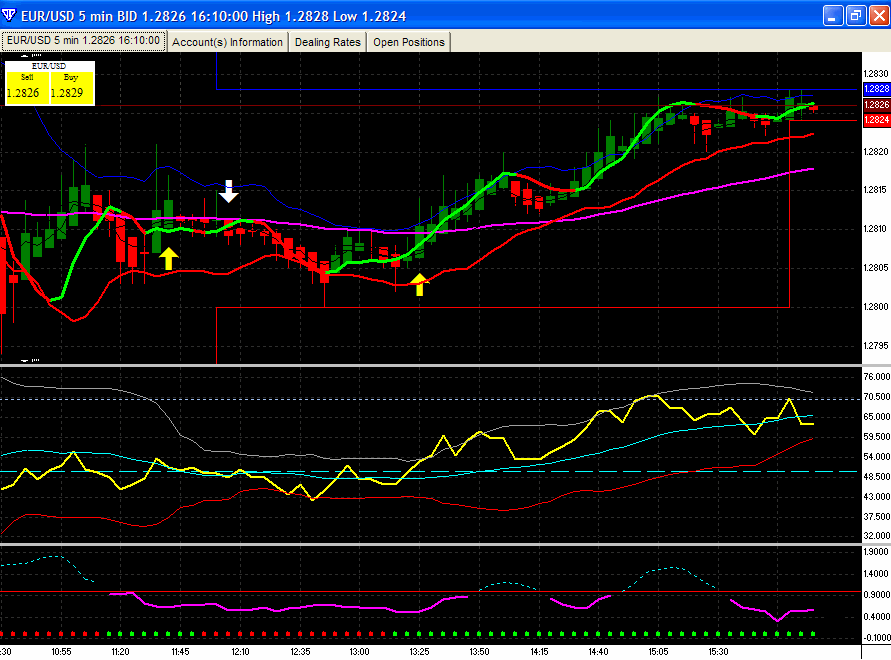
I am attaching a screenshot of what it looks like .. the pink is the squeeze area. Green dots show uptrend and red downtrend.
Thanks a million !! You guys are the best.
..........
I found the tradestation code for this. It should be easier to translate from the tradestation code than the cryptic VT code. I dont know if this is the same as the bollinger squeeze code. It uses a "delta of price from Donchina mid line" which im not familiar with.
-----------
Tradestation Code
That when the Bollinger Band fit inside the keltner channel, a breakout is about to occur. It works on longer term charts, such as 15 minute to daily
charts.
Note: Style needs to be set to histogram.
{ Bolinger Band Squeeze (BBS) Indicator }
{ A variation of an idea by nickm001 (Originally coded by eKam) that when Bollinger Bands (BB) fit inside
the Keltner Channel (KC), a breakout is about to occur. It works on longer term charts, such as
15 minute to daily charts.
This code creates an indicator that plots the ratio of BB width to KC width. When BB and KC widths are
the same, the ratio (BBS_Ind)is equal to one (1). When the BB width is less than the KC Width (i.e. BB
fit inside KC), the BBS_Ind is less than one and a breakout is indicated.
An Alert Line is provided to indicate the level at which the trader considers that the "sqeeze is on" and
a breakout is eminant.
Coded by Kahuna 9/10/2003
Added by eKam: 9/10/2003
The average of where price has been relative to the Donchian mid line and Exponential average of the
same length is also plotted as an attempt to predict the direction of the breakout.
Added 2/1/2005 For decreasing Delta bar....darker colors to highlight the change.}
Inputs: {------------------------------------------------}
Price(Close),
Length(20), { Length for Average True Range (ATR) & Std. Deviation (SD) Calcs }
nK(1.5), { Keltner Channel ATRs from Average }
nBB(2), { Bollinger Band Std. Devs. from Average }
AlertLine( 1 ), { BBS_Index level at which to issue alerts }
NormalColor( Red ), { Normal color for BBS_Ind }
AlertlColor( Blue ) { Color for BBS_Ind below alert line }
;
Variables: {---------------------------------------------}
ATR(0), { Average True Range }
SDev(0), { Standard Deviation }
BBS_Ind(0), { Bollinger Band Squeeze Indicator }
alertTextID(-1)
;
if barnumber = 1 and alertTextID = -1 then
alertTextID = Text_New(date,time,0,"dummy");
{-- Calculate BB Squeeze Indicator ----------------------}
ATR = AvgTrueRange(Length);
SDev = StandardDev(Price, Length, 1);
BBS_Ind = (nBB * SDev) / (nK * ATR);
If BBS_Ind < Alertline then
SetPlotColor(1, NormalColor)
else
SetPlotColor(1, AlertlColor);
{-- Plot the Index & Alert Line -------------------------}
Plot1(0, "BBS_Ind");
{-- Plot delta of price from Donchina mid line ----------}
value2 = LinearRegValue(price-((Highest(H, Length)+Lowest(L, Length))/2
+
xAverage(c,Length))/2,Length,0);
var:color(0); color = yellow;
if value2>0 then
if value2 > value2[1] then
color = green
else
color = darkgreen;
if value2<0 then
if value2 < value2[1] then
color = red
else
color = darkred;
plot3(value2,"BB Squeeze",color);
{-- Issue Alert when the Squeeze is On ------------------}
if BBS_Ind crosses below AlertLine
and Text_GetTime(alertTextID) time then begin
text_setLocation(alertTextID, date, time, 0);
Alert("BB Squeeze Alert");
end;
{-- Issue Alert when the Squeeze Releases ---------------}
if BBS_Ind crosses above AlertLine
and Text_GetTime(alertTextID) time then begin
text_setLocation(alertTextID, date, time, 0);
Alert("BB Squeeze Is Over");
end;
Greetings
I guess the translation is a bit hard -- I need to learn
The BBSqueezes are ok -- but still dont do what this does 
Thanks for trying.
- Free trading apps
- Over 8,000 signals for copying
- Economic news for exploring financial markets
You agree to website policy and terms of use
Greetings
I found a neat indicator for VT somewhere (cant remember where) -- simply coding really
Can anyone translate to Mq4 ?
Thanks
P.S. -- I cant attach it -- would not work -- so if you can do this please pm and I will give you link to it -- thanks