Multiple Pair Analysis
not sure what u mean u want to se the correlation between pairs..?
sailor
Picture
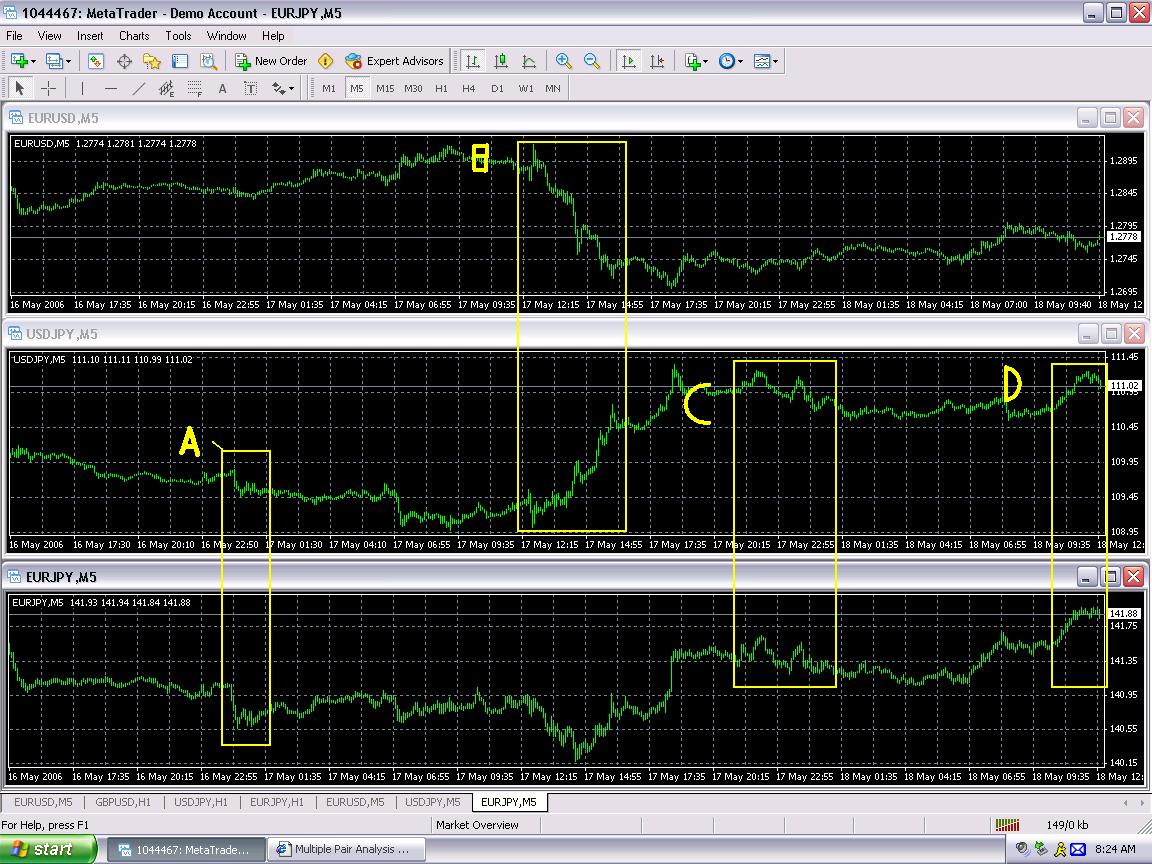
Hey Sailor, thanks for reading/replying to my post. I should have included a picture before, sorry  . It's sort of unclear in words I guess. So to stick with the example of the set EUR/USD, USD/JPY, EUR/JPY, I have attached the 5-minute charts up to this morning (8:30EST/12:30GMT) and circled the illustrative parts. I only highlighted the USD and JPY dominated sections since the EUR chunks are across the screen from each other and would have made the image harder to follow, but I think you should get the idea anyway.
Brief explanation of highlighted parts in picture:
A) A burst in Yen strength causes a sharp drop in both USD/JPY and EUR/JPY, followed by two smaller bump on both charts. The relatively flat EUR/USD above makes the correlation less muddled.
B) WE MUST MENTALLY FLIP THE USD/JPY CHART! Since the USD occurs as the first item in the pair the chart is upside down. However, if you look at the up/downtrending part circled, the bursts/corrections are mirrored between EUR/USD and USD/JPY. It is messed up slightly because the EUR/JPY isn't very flat at the time, so we must try to think of subtracting out the relative changes in values of these two...correlation is still pretty apparent though.
C) Bump, bump, bump. Don't think I need to explain.
D) As the Yen weakens and the EUR/USD stays flattish, we see an uptrend in the USD/JPY and EUR/JPY.
Basically, I want to seperate out individual currency's actions and see how these relate to each other. Do you understand now? Sorry if I am still not explaining well.
There is an indicator called dollar index, that shows the usd extracted from the four majors. It has a few bugs in it and takes lots of computing power, if the programmers could have a second look at it, it might be a very useful tool.
This is not true. I repeat, this doesn't work like it. I thought it did, and paid a lot for my mistake. Don't do it. I took a short on cable prior to the big upswing, and "hedged" it with eurusd and eurgbp. It did't move much, but after cable moved 1400 pips against me, it "let through" over three hundred pips!!! This doesn't work. I can't explain it, it surprised me very much too.
Otherwise, watching related pairs does help to have a general perspective of what's happening, why the moves happen and on which currency, but I don't really know how it can be used for trading really. It helps me have a better feel for the markets though.
Dollar index, you say...
Hey, thanks a lot for the response DanielTyrkiel! I didn't realize someone had already done this...like I said I'm kinda new to this. As for why your hedging let through 300 pips...umm..hmmm...that's really weird. I don't get it either. I think I understand why it would let through some actual cash difference, though: one pip isn't worth the same cash amount for each pair (The big pairs are $10perlot, USD/JPY is less, EUR/GBP is more. Thus you'd want to buy more lots of ones which are less, than $10 per,less lots of the ones that are more per; You probably know this, I'm just relating). But anyway..interesting.
Thanks again for the response, and maybe some brilliant programmer around here can make a Yen index or Pound index too. I'd be really interested in seeing how individual currencies influence each other (if they do).
Also, thanks for the advice Sailor...I'll watch the GBP/CHF in the coming weeks.
Hey, thanks a lot for the response DanielTyrkiel! I didn't realize someone had already done this...like I said I'm kinda new to this. As for why your hedging let through 300 pips...umm..hmmm...that's really weird. I don't get it either. I think I understand why it would let through some actual cash difference, though: one pip isn't worth the same cash amount for each pair (The big pairs are $10perlot, USD/JPY is less, EUR/GBP is more. Thus you'd want to buy more lots of ones which are less, than $10 per,less lots of the ones that are more per; You probably know this, I'm just relating). But anyway..interesting.
Thanks again for the response, and maybe some brilliant programmer around here can make a Yen index or Pound index too. I'd be really interested in seeing how individual currencies influence each other (if they do).
Also, thanks for the advice Sailor...I'll watch the GBP/CHF in the coming weeks.There is an old thread on this forum that attempted to do what your talking about. It had some errors in logic and didnot work right. The main idear was to find the underliing strength of a currency, however, the strenght of the pair was defind instead. Other difficultes incountered was that the currency pairs were not normalized and therefore were on different scales and couldnot be compaired to each other. Finial as you say the pip values are different on some pairs and therefor if the scale between the currencies were normalized a similar result between two currencies would render different returns. The threads ended in a confussion between Relative Strength and corrolations analysis.
One would have to overlook corrolation studies and focauss on the currency's indiviual relative strength. The results would have to be normalized so each currency can be compaired to one another and the pip value would have to be a consideration.
The CockeyedCowboy
I see...thanks for the summary Cowboy. I'm still quite interested in seeing some indexes (indices?) for various currencies, but I have no such programming abilities to do what you said and make a working indicator. Perhaps we can entice Igorad or Nicholishen or Codersguru or some such pro to take interest in this and help develop it? That is, if a few others would also like to see something like this programmed...
Some indicators related to Multiple Pair Analysis were posted here https://www.mql5.com/en/forum/173001
- Free trading apps
- Over 8,000 signals for copying
- Economic news for exploring financial markets
You agree to website policy and terms of use
Greetings everyone!
I am quite new to this forum and only slightly less new to forex in general, but I have been trying to think of novel approaches to technical analysis for several months. I am only so-so at programming, so I am unable to code any of the following ideas. But if any of you pros around here think I have a good idea or two, please let me know so we can try to develop them!
There are so many good ideas on this forum, but a common limitation, I think, is that they only focus on 1 given pair. This treats forex sort of like stocks (with short-selling), which is not really true; forex positions are a relation between two values. Thus, I would like to try to develop an indicator (or eventually EA) that parses out the market trends and relatives strengths from setsof currency pairs. In other words, we look for example at EUR/USD, USD/JPY, and EUR/JPY. When visually comparing the three charts simultaneously on the same timeframe, it is clear that the market is sometimes driven primarily by just ONE of the currencies. For our example, let's say that EUR is dictating most of the price action in EUR/USD and EUR/JPY; these graphs will look very similar. In order to separate the EUR action from the other two, we can look at what the USD and JPY are doing relative each other in the USD/JPY chart, and subtract it out of the EUR pairs. Sometimes, price action the the 3 pairs will be driven by 2 of the currencies, and sometimes all three will be playing significant roles. What I would like to do is to have an indicator that displays the individual action of each currency itself, so say three lines, a EUR line, USD line, and JPY line. If EUR is bullish, the line should be heading upwards, and if bearish it should be heading down; similarly for the others. The patterns of these lines when drawn on top of each other should be very telling for future market movement I think....the impulse from one currency (not pair) instigates predictable reactions in the others....do people agree?
Second related thought: If all of the individual currency strenghts/movements could be plotted on one chart, we could pick the most strong currency paired with the most weak in order to pick a good pair to trade on. Or, perhaps, use the same tecnique to try to find the best pair to trade on in the future?
Third related thought: If we open what I think of as a "circular trade," in other words, equal shares* of buy EUR/USD, buy USD/JPY, sell EUR/JPY, we will see that we never really lose much more money than the pip spreads, since some market movement will be in our direction and some against. I was thinking maybe we can have an optimal ratio of SL/TP that is the same for all the pairs? Or perhaps we reverse the losing-most pair's direction?
Just some ideas from a self-acknowledged n00b here, but I welcome any feedback/constructive thoughts/direction/whatnot.
Thanks for your time ,
,
Gavner