Ichimoku
Ichimoku EA
I have an Ichimoku EA already (ichimoku5.mq4) but it doesn't seem to do what I want. I'd like it to do the following...
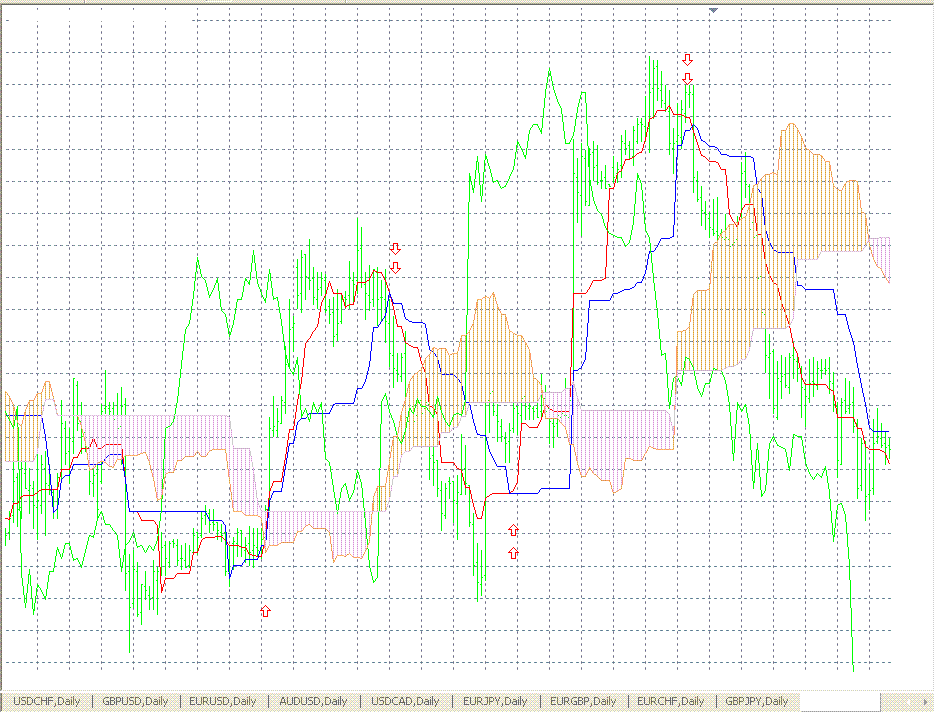
1) Buy a lot when the tenkan line crosses the kijun line from below (and sell when it crosses from above).
2) Cover the existing position and open a new position going the other way when the lines cross again.
I've attached an image of what I think it should look like. If there's an EA out there like this already please let me know.
--Edit...if you want to add take profit and s/l as an input that'd be great too...and whatever else you'd recommend.--
The other indicators created by Igorad. May be very usefull for timeframes less then H4 for example.
MTF Ichimoku indicator is here https://www.mql5.com/en/forum/173574/page27
Ichimoku as Histogram
Hello every body
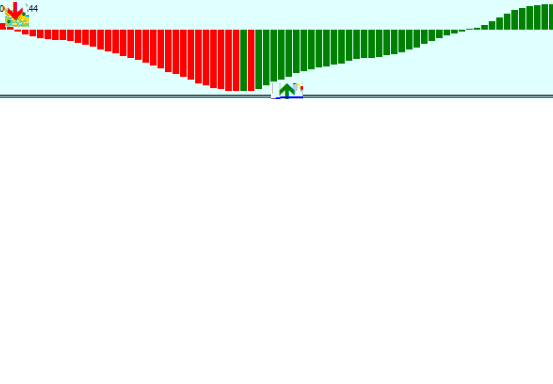
please i am searching for Ichimoku as HISTOGRAMwith colors in separet windows..
JUST TO BE IN SIMPLE WAY (GREEN to show upternd area and an ARROW as BUY SIGNAL --or --RED to show downtrend area and an ARROW as SELL SIGNAL ,IN SEPARET WINDOW) 
Acutly i feel confuzed many times when i try to deal with Ichimoku especialy because my chart is already has indicators on it,so it is completely hard for me to follow Ichimoku ...
i have been reading those threads for NEWDIGITALS https://www.mql5.com/en/forum/172986 I GOT MORE HARD TIME...it is very usefull but hard for me...
please if it possible somebody help me to get it or if you have time to program it and post it...
thank you in advance
ichimoku
hi
this would be great if its easy like this. ichimoku is an art to trade. it has a lot of information if the trend is up or down or ranging. What you mean with an histogram-- of what? if kijunsen cross tenkan sen? i think you mean this or? that would be easy to make in a histogram but thats not a valid ichimoku interpretation.
see
https://www.mql5.com/en/forum/177647
regrads lodol2
hi
this would be great if its easy like this. ichimoku is an art to trade. it has a lot of information if the trend is up or down or ranging. What you mean with an histogram-- of what? if kijunsen cross tenkan sen? i think you mean this or? that would be easy to make in a histogram but thats not a valid ichimoku interpretation.
see
regrads lodol2thank you very much for your fast reply
yes ,you are very right of what you said and i know what you mean..but what i meant by histogram is to be something easier than now (for example like the row MACD HISTOGRAM)..but it seems like dream to have it that way..
SO,HOW ABOUT TO DONE IT AS HISTO WHEN(kijunsen cross tenkan sen) and then we creat easer view for the rest of the stratgy!!!?..
thank you again for you responce again
hi
Hello
yes i think this should be done easy to show the cross. but not so easy to see other information,like i showed in my idea. not so much people here use ichimouku, i dont know if someone is instrested to program this. i myself have no programming skills..
So you use ichimoku as a part of a trading system?
all the best to you
lodol
Ichimoku idea
Hi,
I'm not a coder, but have manually tested an idea I had on the EUR/USD on a daily time frame.
Looks very promissing imo.
It goes like this:
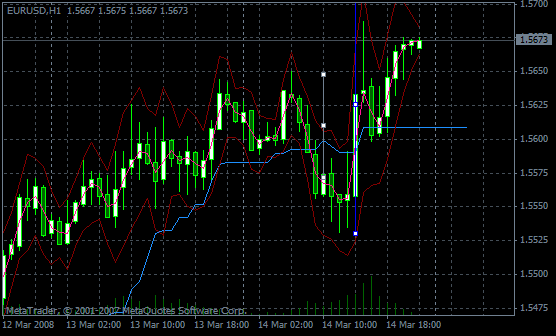
You take only the Kijun-Sen of the Ichimoku indicator.
I made the color Aqua, and made the rest of them black.
If price crosses Kijun-sen, and closes above(or below) Kijun sen, you enter a trade on the open of the next bar.
Example, KS(Kijunsen) is curr. 1.5500, price crosses KS tp the upside and closes EOD above 1.5500, you enter a long trade.
And ofcourse vice versa for a short entry.
Now for the SL and the TP.
I used the ATR indicator for that.
At entry you look at the value of the ATR.
You multiply that value with 1.5 for SL.
Is all goes well, the price will start to move up, if not, you have your SL in place.
Everyday you adjust the SL according the new high the price makes and the value of the ATR, as it is changing(volatilitydepended).
The SL will become your TP, as price moves on.
I also closed the trades during testing before the SL was hit, if the trade turned against me right after entry, if price turned around and closes below the KS with a margin of 10 (close bar under KS -10 pips), or whatever value you prefer.
So it should look something like this imo:
Take value KS
If price is above KS and closes above KS enter long
take ATR x 1.5 for SL
else if price next bar closes below KS -10 also close trade(whatever comes first)
Adjust SL according the value(high) of next bar and value ATR
Just reverse for shorts.
Who can make an EA for this idea to test it on all other pairs on different timeframes ?
Would be nice ofcourse if one can play with values of the KS and other values.
Is it also possible to implement Moneymanagement with it ?
I tested it manually on the EUR/USD for 2006 and it made over 1500 pips with 13 trades, 3 losers and 10 winners.
Will do more testing on other years and pairs.
I hope I made things clear, and I hope I haven't forgotten anything.
I hope someone can help me with this.
Profitman
- Free trading apps
- Over 8,000 signals for copying
- Economic news for exploring financial markets
You agree to website policy and terms of use
It is classical indicator. You may find it in your MetaTrader.
How to trade.
Other Ichimoku indicators which may be used with the classical one.
Read more about Ichimoku.