Silver Analysis Please..
Hi mitulbang,
Everything is simple with silver (with XAGUSD for example).
==============
You know that analysis of every pair consists of the following :
- fundamental analysis
- technical analysis
==============
Fundamental Analysis
There are 2 news events which may be affected on the price movement for XAGUSD :
- 2014-01-08 19:00 GMT (or 20:00 MQ MT5 time) | [USD - FOMC Meeting]
- 2014-01-10 13:30 GMT (or 14:30 MQ MT5 time) | [USD - Non-Farm Employment Change]
Time for FOMC Meeting may be changed (on Monday for example).
- www.metatrader5.com
Technical Analysis
This kind of analysis is made based on indicators, or/and based on support/resistance levels.
Which indicators? Ichimoku, or Digital Filters, or Moving Average indicators, Stochastics and so on. I am using Ichimoku because we may have 60% probability concerning it (in case we are taking onto consideration all Ichimoku signals). There are some people who do not like Ichimoku indicator, and they use Moving Averages indicators instead (many of MAs attached to the chart ... with 60% probability too).
==============
D1 timeframe.
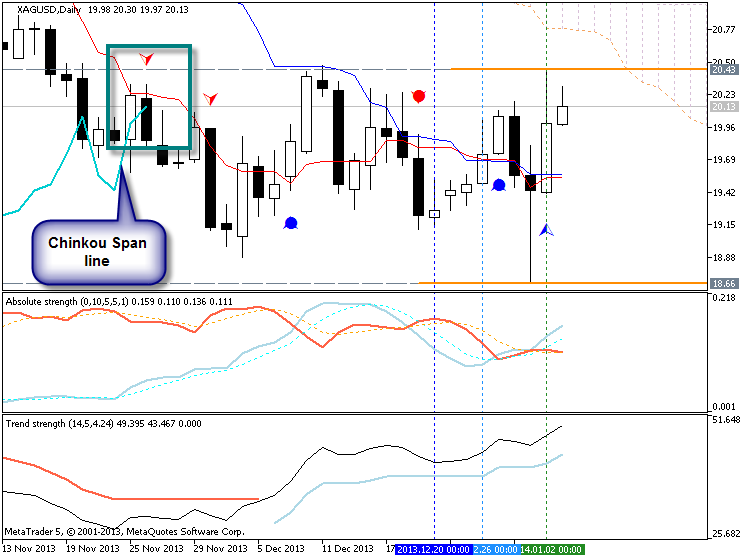
We see that Chinkou Span line is touching historical price from below to above which means - we may have good breakout for the near future. But it is D1 timeframe, and 1 bar on D1 timeframe = 1 day. And as we see from the image below - this line (Chinkou Span line) is just touching the price ... may be - this line will cross the price on Monday or later next week/ But we (in technical analysis) is always talking about close bar only so - this crossing/breaking should be on close bar (that means - it may be later on next week) :
But! ... The price is below Ichimoku cloud (name of Ichimoku cloud = kumo). Do you see the border of the cloud? The name of those borders/lines are the following:
- Sinkou Span A
- Sinkou Span B
How to I know/remember such the words? You can attach Ichimoku indicator and move mouse to any of the lines - and you will see the name of the line.
Sinkou Span A line is some kind of virtual "border" between primary bullish and primary bearish :
- if price is below Sinkou Span A - bearish
- opposite for bullish
Thus, if Chinkou Span line will cross historical price from below to above on close bar so we may have rally. Why rally? because local uptrend within primary bearish = rally. Why XAGUSD D1 is on bearish? because the price is below Sinkou Span A line.
But if Chinkou Span line will not cross the price from below to above, and if the price will not break 20.43 resistance level (see image above)? If not so the price will be floating between 20.43 resistance and 18.66 support and we will see the ranging market condition (for D1 for example).
Why 20.43 is resistance level, and 18.66 is support level? because 20.43 is above the price now, and 18.66 is below the price (see image above).
==============
if we know the terms (correct terminology in technical analysis ... means - the meaning of some official terms/words) so we all can make it in easy way.

- www.mql5.com
Week 2 starting - Daily chart: it seems to me that after a very long bearish situation since the first days of December started a flat market between 18.80 and 20.20. Maybe soon can revert the trend.
Agree with newdigital: at 20.43 the Red indicator inside the chart will turn blue. So a new bullish trend. Considering also that price just entered an overbought situation close to the indicator probably will happen soon.

Week 2 starting - Daily chart: it seems to me that after a very long bearish situation since the first days of December started a flat market between 18.80 and 20.20. Maybe soon can revert the trend.
Agree with newdigital: at 20.43 the Red indicator inside the chart will turn blue. So a new bullish trend. Considering also that price just entered an overbought situation close to the indicator probably will happen soon.
Forum on trading, automated trading systems and testing trading strategies
newdigital, 2014.01.05 06:18
Silver plunged 36 percent in London last year and gold slid 28 percent, both the most since 1981, as some investors lost faith in the metals as a store of value. The U.S. Federal Reserve is slowing stimulus amid an improving economy and global equities reached the highest since 2007 this week. While investors sold bullion from gold-backed exchange-traded products, lower prices boosted jewelry, bar and coin demand from the U.S. to China.
“Some people took the opportunity of lower prices and bought remarkable amounts of gold and silver,” Daniel Briesemann, an analyst at Commerzbank AG in Frankfurt, said today by phone. “Generally, prices are very attractive. Demand is very robust in Turkey and the Arab world as well.”
Thus, if Chinkou Span line will cross historical price from below to above on close bar so we may have rally. Why rally? because local uptrend within primary bearish = rally. Why XAGUSD D1 is on bearish? because the price is below Sinkou Span A line.
But if Chinkou Span line will not cross the price from below to above, and if the price will not break 20.43 resistance level (see image above)? If not so the price will be floating between 20.43 resistance and 18.66 support and we will see the ranging market condition (for D1 for example).
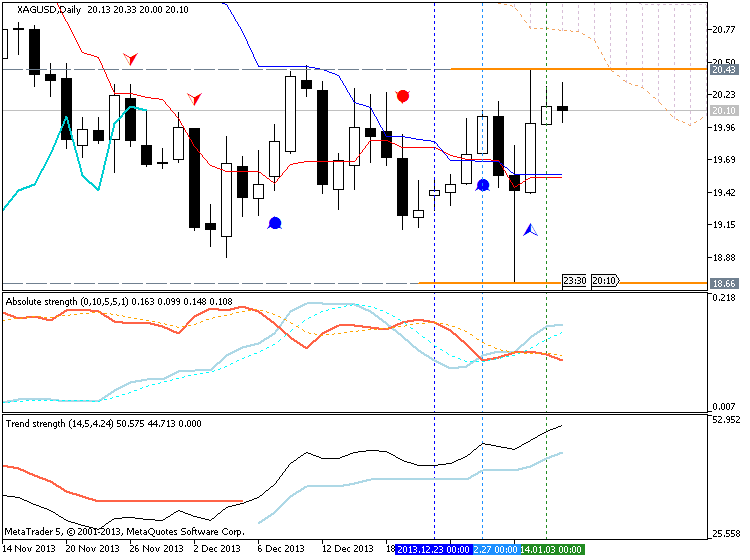
Chinkou Span line crossed historical price on close bar but on almost horizontal way sorry. Means - flat or ranging.
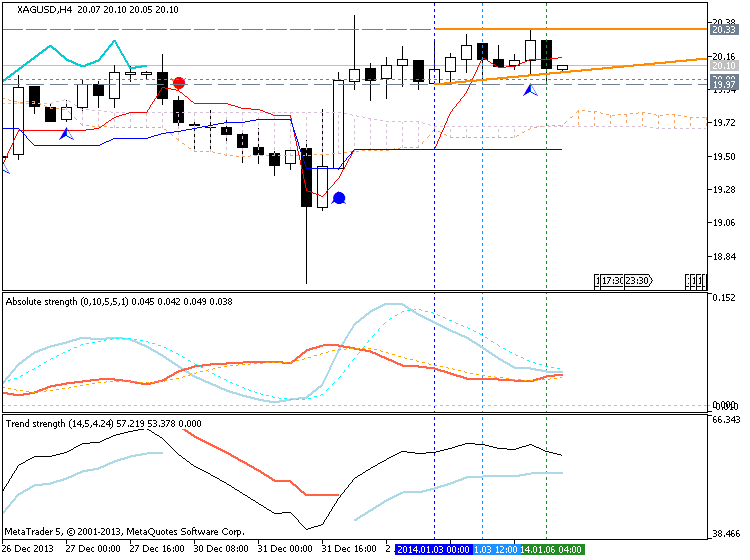
H4 timeframe - flat :
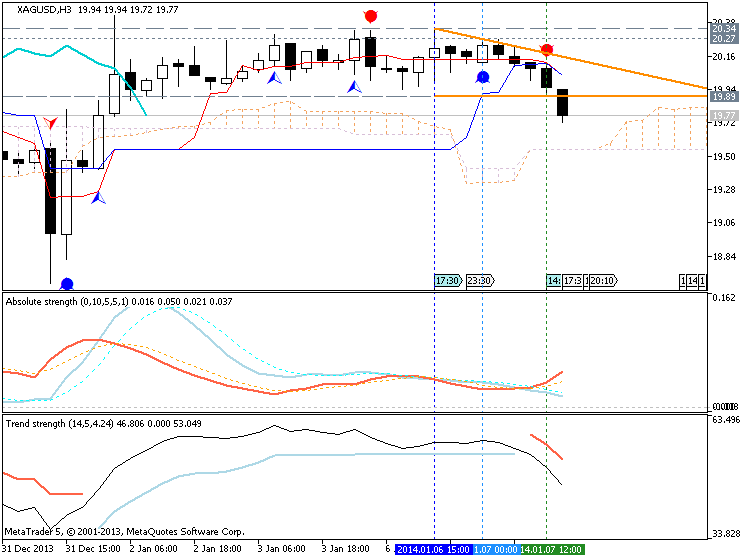
So, we will wait for the following news events hoping that they (news) will move the price :
Forum on trading, automated trading systems and testing trading strategies
newdigital, 2014.01.04 15:04
Hi mitulbang,
Everything is simple with silver (with XAGUSD for example).
==============
You know that analysis of every pair consists of the following :
- fundamental analysis
- technical analysis
==============
Fundamental Analysis
There are 2 news events which may be affected on the price movement for XAGUSD :
- 2014-01-08 19:00 GMT (or 20:00 MQ MT5 time) | [USD - FOMC Meeting]
- 2014-01-10 13:30 GMT (or 14:30 MQ MT5 time) | [USD - Non-Farm Employment Change]
Time for FOMC Meeting may be changed (on Monday for example).
Forum on trading, automated trading systems and testing trading strategies
newdigital, 2014.01.06 17:44
2014-01-06 15:00 GMT (or 16:00 MQ MT5 time) | [USD - ISM Non-Manufacturing PMI]
- past data is 53.9
- forecast data is 54.6
- actual data is 53.0 according to the latest press release
if actual > forecast = good for currency (for USD in our case)
==========
U.S. Service Sector Unexpectedly Expands At Slower Rate In December
Activity in the U.S. service sector unexpectedly grew at a slower rate in the month of December, according to a report released by the Institute for Supply Management on Monday.
The ISM said its non-manufacturing index edged down to 53.0 in December from 53.9 in November, although a reading above 50 still indicates growth in the service sector. With the drop, the index fell to its lowest level since hitting 52.8 in June.
MetaTrader Trading Platform Screenshots
MetaQuotes Software Corp., MetaTrader 5, Demo
XAGUSD M5 : 32 points price movement by USD - ISM Non-Manufacturing PMI news event

Forum on trading, automated trading systems and testing trading strategies
newdigital, 2014.01.06 18:38
What is the Pip Cost for Gold and Silver?
- Gold: Symbol XAU/USD
The pip cost for 1 ounce of Gold (minimum trade size) is $0.01 per pip. - Silver: Symbol XAG/USD
The pip cost for 50 ounces of Silver (minimum trade size) is $0.50 per pip
Please help me and give your detailed analysis for silver.......
Are you interested in a long-term, medium-term or short-term forecast?
Long-term trend and forecast - fall.
But in the last month and went into the flat and possible reversal. Key Price Guide: Buying - 20.89; Sale - 18.62.
