Indicators: Ticks indicator
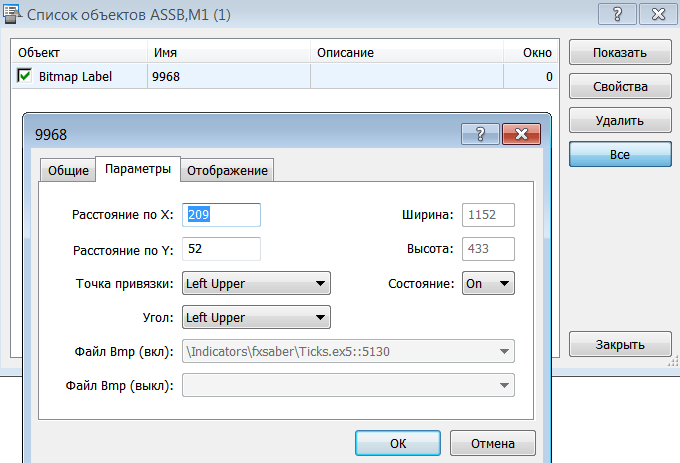
используется один из кастомных видов интерактивных графических объектов
If you need to delete/copy (drag with the mouse with CTRL pressed)/move or make other manipulations with an object, it is all available in manual mode through the standard panel of work with graphical objects
I am writing my own tick indicator. It turned out that it is more difficult to come up with a convenient (not fancy) indicator than to write one.
Specifically through this posted indicator I wanted to collect critical comments and recommendations in order to take them into account in my own.
Of course, this is not altruism, but writing for myself. Putting it out in the kodobase is a side effect.
It's a pity that low scores are left without comments.
I am writing my own tick indicator. It turned out that it is more difficult to come up with a convenient (not fancy) indicator than to write one.
Specifically through this posted indicator I wanted to collect critical comments and recommendations in order to take them into account in my own.
Of course, this is not altruism, but writing for myself. Putting it out in the kodobase is a side effect.
It's a shame that low scores go uncommented on.
If you move down by 1/2 of a typical spread (and it is better to draw the main candles at (bid+ask)/2 ), it will be more informative/clearer.
What should I move for clarity? The indicator does not touch candlesticks - the terminal draws them.
Move theindicator readings down a bit - otherwise Bid merges with candlesticks on the history and the indicator looks like a certain upper envelope.
If you draw it a little lower, it is easier to see how a particular candle was formed.
shift indicator readings downwards - otherwise Bid merges with candlesticks on the history and the indicator looks like a certain upper envelope
If you draw it a little lower, it is easier to see how a particular candle was formed.
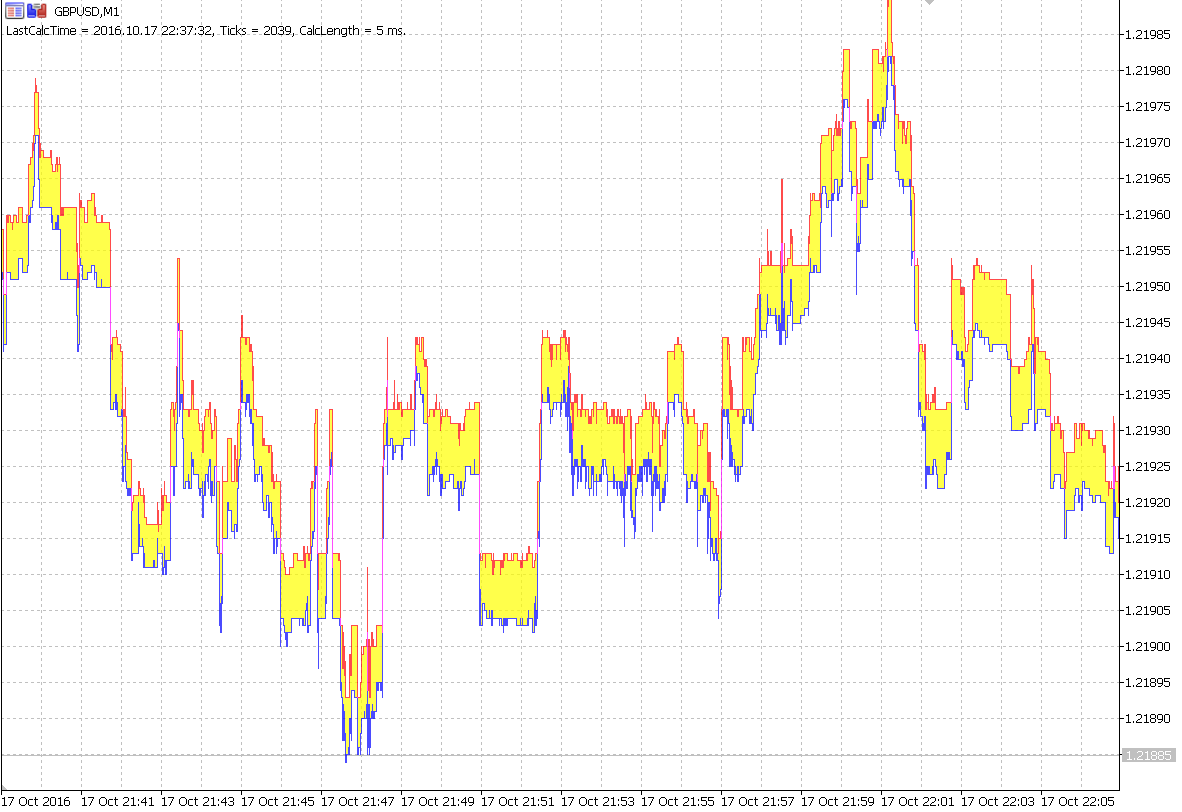
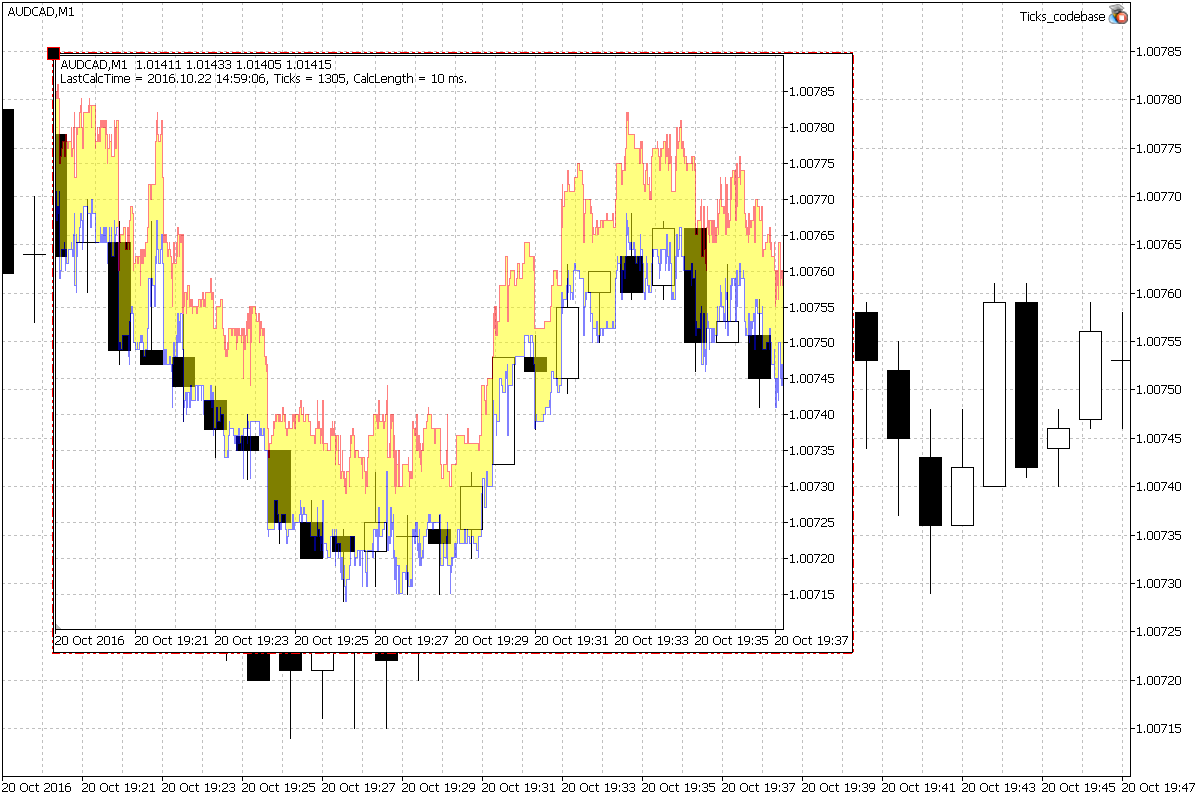
If bid candlesticks, the bid line (by default, blue - lower) will show the complete formation of each bar.
You can disable the display of fill (yellow) and ask (red) in the settings. You can also set the transparency to 255.
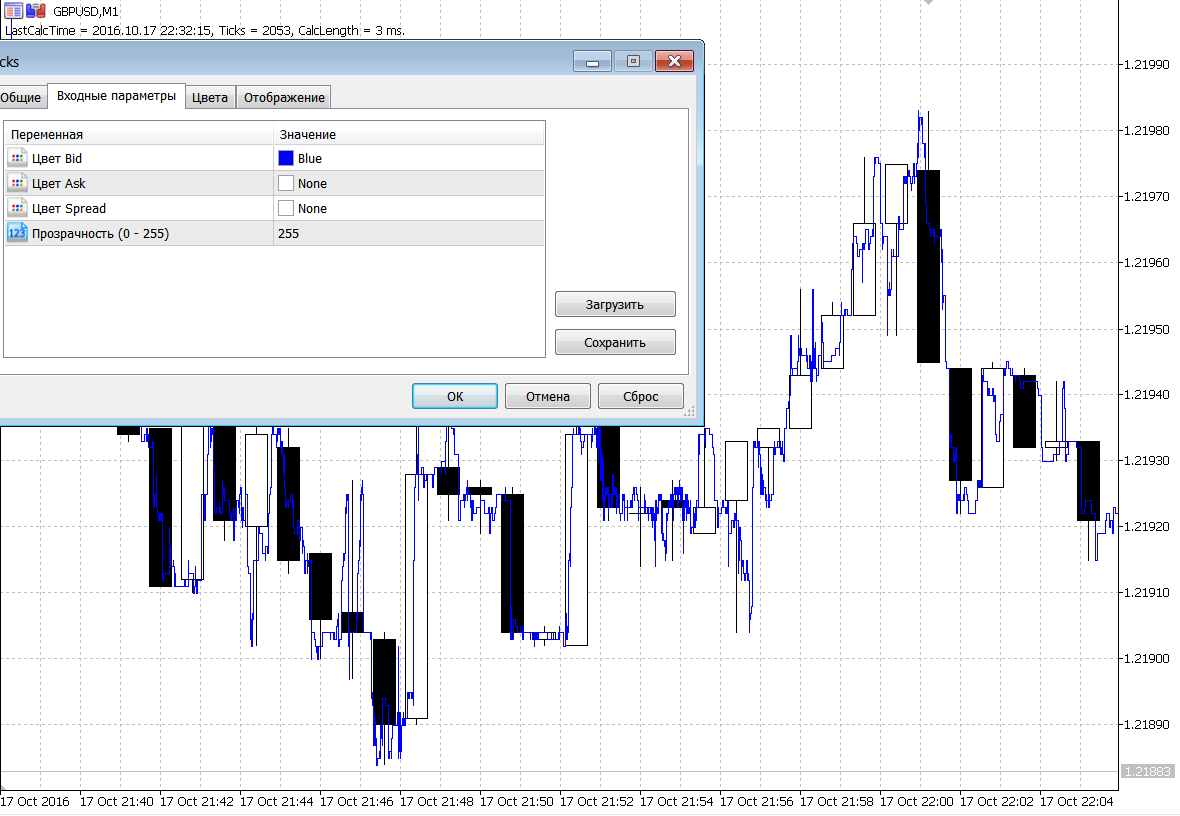
You can see well how the bid-price moves inside each bar. The X-coordinate here corresponds to ticks at the interval of ~2 seconds.
It is impossible to shift, because the prices fully correspond to the chart scales - both time and price.
It is possible to switch off the bars display at all and use ONLY this indicator. There will be no loss of information at all, bars are made of ticks. Here is the same piece
It is possible to switch off the bars display by hand (it is necessary to add an automat) and use ONLY this indicator. There will be no loss of information at all, bars are made of ticks.
We hang our indicators in the usual way and without visualisation of bars we get much more price historical information
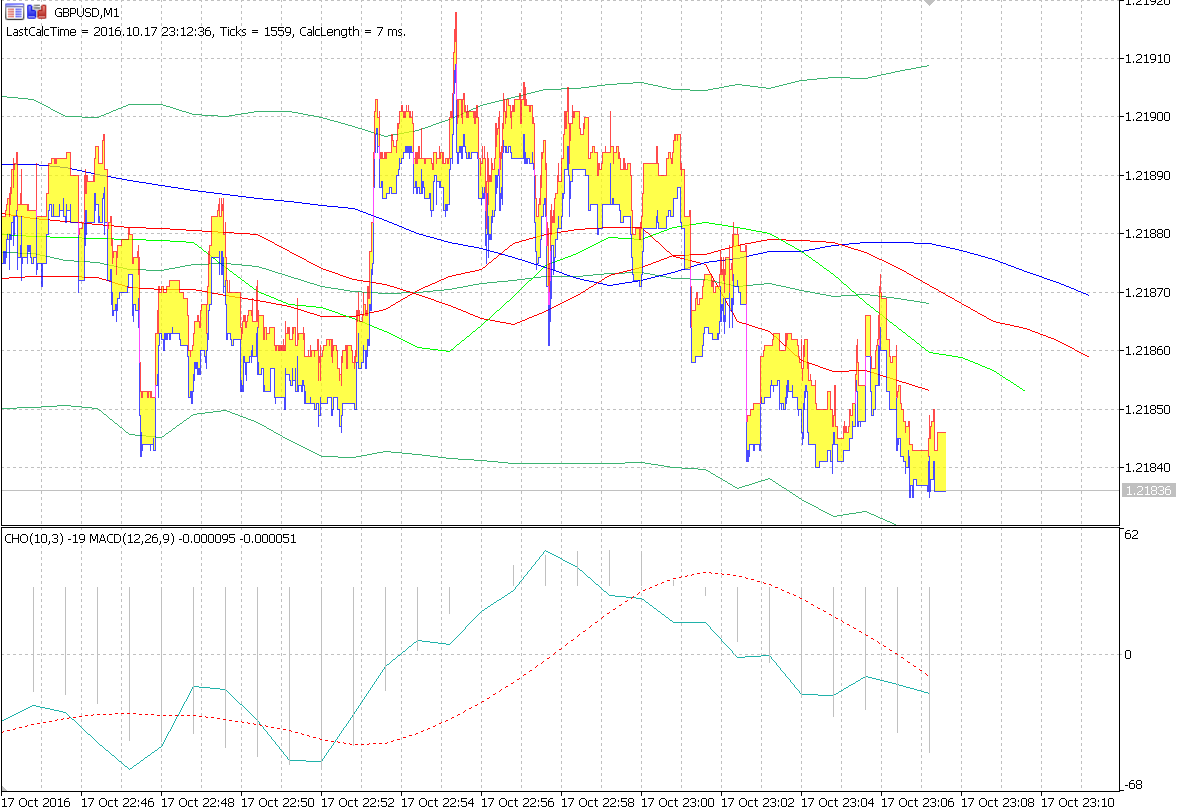
Whether the price reached buystop or buylimit is immediately visible. Well and much more. Claims to the broker or their deviation are easy to justify.
#include <fxsaber\ChartObjects\ChartObject_Chart.mqh>
#include <fxsaber\ChartObjects\ChartObjectTicks.mqh>
CHARTOBJECT* Chart;
CHARTOBJECT* ChartTicks;
void OnInit()
{
Chart = new CHARTOBJECT_CHART(0, 0, true);
ChartTicks = new CHARTOBJECTTICKS(Chart.GetChartID());
}
void OnDeinit( const int Reason )
{
POINTER::DeleteObject(ChartTicks);
POINTER::DeleteObject(Chart);
}
void OnChartEvent( const int id, const long& lparam, const double& dparam, const string& sparam )
{
EVENTBASE::MyEvent(id, lparam, dparam, sparam);
}
void OnTick( void )
{
if (::ChartGetInteger(Chart.GetChartID(), ::CHART_FIRST_VISIBLE_BAR) <= ::ChartGetInteger(Chart.GetChartID(), ::CHART_VISIBLE_BARS))
ChartTicks.Visual();
}
It worked!
I am writing my own tick indicator. It turned out that it is more difficult to come up with a convenient (not fancy) indicator than to write one.
Specifically through this posted indicator I wanted to collect critical comments and recommendations in order to take them into account in my own.
Of course, this is not altruism, but writing for myself. Putting it out in the kodobase is a side effect.
It's a shame that low scores go uncommented on.
Idid. No wishes were ever made, but it turned out more than I intended. The power of MT5!

- 2016.11.01
- //www.mql5.com/ru/users/fxsaber">
- www.mql5.com
- Free trading apps
- Over 8,000 signals for copying
- Economic news for exploring financial markets
You agree to website policy and terms of use
Ticks indicator:
It shows the tick price history (Bid/Ask) within all visible bars.
Author: fxsaber