Forecast for Q1'17 - levels for Brent Crude Oil - page 3
You are missing trading opportunities:
- Free trading apps
- Over 8,000 signals for copying
- Economic news for exploring financial markets
Registration
Log in
You agree to website policy and terms of use
If you do not have an account, please register
Forum on trading, automated trading systems and testing trading strategies
Press review
Sergey Golubev, 2017.02.28 15:43
Intra-Day Fundamentals - EUR/USD and Brent Crude Oil: U.S. GDP Second Release
2017-02-28 13:30 GMT | [USD - GDP]
if actual > forecast (or previous one) = good for currency (for USD in our case)
[USD - GDP] = Annualized change in the value of all goods and services produced by the economy.
==========
From official report:
==========
EUR/USD M5: 16 pips range price movement by U.S. Gross Domestic Product news events
==========
Brent Crude Oil M5: 19 range price movement by U.S. Gross Domestic Product news events
Forum on trading, automated trading systems and testing trading strategies
Press review
Sergey Golubev, 2017.03.07 06:15
Brent Crude Oil - ready to go (adapted from the article)
Daily price is located near and above Senkou Span line which is the virtual border between the primary bearish and the primary bullish trend on the chart. The price is moving along the upper border of Ichimoku cloud to be ready for bearish reversal or to the bullish trend to be resumed.
s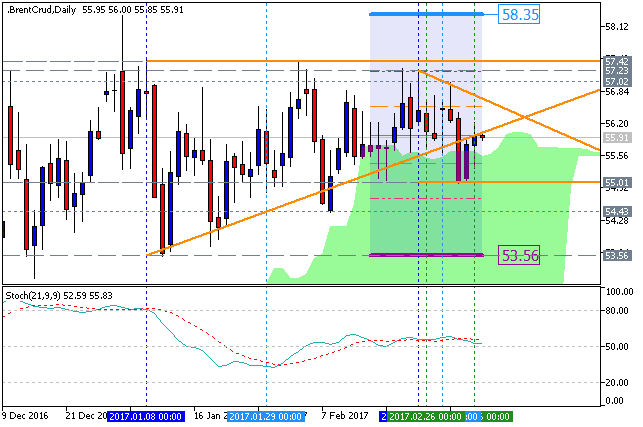
Forum on trading, automated trading systems and testing trading strategies
Press review
Sergey Golubev, 2017.03.10 15:08
Intra-Day Fundamentals - EUR/USD, GBP/USD, BTC/USD and Brent Crude Oil: Non-Farm Payrolls
2017-03-10 13:30 GMT | [USD - Non-Farm Employment Change]
if actual > forecast (or previous one) = good for currency (for USD in our case)
[USD - Non-Farm Employment Change] = Change in the number of employed people during the previous month, excluding the farming industry.
==========
From official report:
==========
EUR/USD M5: 45 pips range price movement by Non-Farm Payrolls news events
==========
GBP/USD M5: 42 pips range price movement by Non-Farm Payrolls news events
==========
BTC/USD M5: range price movement by Non-Farm Payrolls news events
==========
Brent Crude Oil M5: range price movement by Non-Farm Payrolls news events
Brent Crude Oil H12 timeframe: the price was on bearish breakdown by crossing Ichimoku cloud to below for the reversal of the price movement from the ranging bullish to the primary bearish market condition. For now, the price is forming the bullish retracement pattern to be bounced from 51 resistance level to above for the secondary rally to be started.
Forum on trading, automated trading systems and testing trading strategies
Press review
Sergey Golubev, 2017.03.11 18:39
Weekly Fundamental Forecast for Crude Oil (based on the article)Crude Oil - "The EIA figures inevitably prompted worries about the balance between supply and demand as US shale extraction capacity grows. With a lower breakeven price than many other sources of oil, fears that US output will flood the markets sent them into a spin, along with energy stocks and the currencies of oil-producing countries like Norway, Russia and Canada."
Forum on trading, automated trading systems and testing trading strategies
Press review
Sergey Golubev, 2017.03.16 08:18
Brent Crude Oil - daily bearish with 50.23 support level (based on the article)
Daily price broke Ichimoku cloud to below for the reversal from the ranging bullish to the primary bearish market condition. The price is testing support level at 51.12 and 50.23 to below for the bearish trend to be continuing, otherwise - ranging.
Forum on trading, automated trading systems and testing trading strategies
Press review
Sergey Golubev, 2017.03.18 14:35
Weekly Fundamental Forecast for Brent Crude Oil (based on the article)Brent Crude Oil - "The recent drop in price could be due to hedge funds getting out of the market reducing their extreme long positions relative to institutional hedges. Given the large buying volume possibly exiting the market, it’s fair to ask what would cause them to re-enter the market? Many are counting on hopes of rising demand and an OPEC-cut extension, but it may require a larger shift in the supply-demand imbalance despite OPEC’s recent efforts as the average US Crude Stockpiles have gained steadily due to Shale production. Hedge funds are likely to require much lower prices before accumulation begins again or a shock higher in Bullish Momentum, which has currently vanished."
Forum on trading, automated trading systems and testing trading strategies
Press review
Sergey Golubev, 2017.03.21 08:01
Crude Oil and the correlation in trading: Crude Oil Pitfalls (based on the article)
Daily price is on secondary correction which was started in the beginning of March this year: price broke key support levels to below for 200-day SMA value at 50.8 to be testing to below for the daily bearish reversal. On the monthly basis - the price dropped by 8.06% to below (monthly) which is indicating the high volatility for example.
Forum on trading, automated trading systems and testing trading strategies
Press review
Sergey Golubev, 2017.03.22 17:41
U.S. Commercial Crude Oil Inventories news event: intra-day bearish ranging, daily bearish reversal
2017-03-22 14:30 GMT | [USD - Crude Oil Inventories]
[USD - Crude Oil Inventories] = Change in the number of barrels of crude oil held in inventory by commercial firms during the past week.
==========
"U.S. commercial crude oil inventories (excluding those in the Strategic Petroleum Reserve) increased by 5.0 million barrels from the previous week."
==========
Crude Oil M5: ranging bearish. The price was ranging near and below 200 SMA in the bearish area of the chart: the price was bounced from 200 SMA to below for 50.14 support level to be testing for the bearish trend to be resumed.
If the price breaks 50.52 resistance level to above on M5 close bar so the bullish reversal will be started.
If the price breaks 50.14 support so the bearish trend will be resumed.
If not so the price will be on ranging within the levels.
==========
Crude Oil Daily: bearish reversal. The price is breaking 200-day SMA together with 50.23 to below for the reversal to the bearish market condition.
If daily price breaks 57.42 resistance on close daily bar so the primary bullish trend will be resumed with 58.35 nearest bullish target.
If the price breaks 52.63 support level to below so the bullish trend will be resumed.
If not so the price will be on ranging within the levels waiting for direction.
Forum on trading, automated trading systems and testing trading strategies
Press review
Sergey Golubev, 2017.03.25 12:38
Weekly Fundamental Forecast for Crude Oil (based on the article)Crude Oil - "On Friday, we got word from Baker Hughes International that the U.S. Oil Rig Count Report had risen 21 rigs to 652 active rigs. This number is over double the number of active rigs from last summer at around 330. As you would expect, the majority of rigs being reinitiated are in the cheaper to produce shale regions."