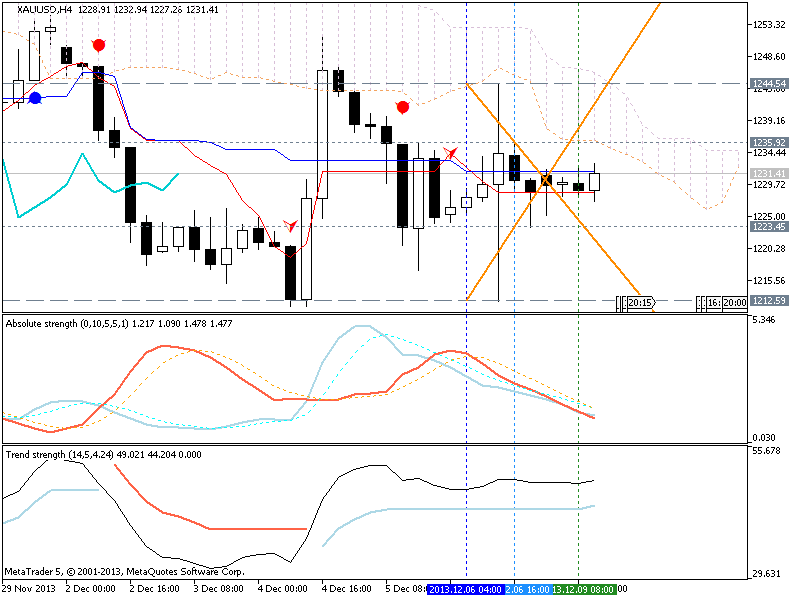
XAU/USD
- when price will break 1244.54 resistance - buy
- if the price will break 1212.59 from above to below - sell
I am using this indicator - MaksiGen_Range_Move MTF
Market Condition Evaluation based on standard indicators in Metatrader 5
newdigital, 2013.10.17 12:47
Some people asked : what is Paramon Trading system ? indicators? template? well ...
============
Please find 2 indicators and 1 template in zip attachment (see the attachment on this post).
How to install
- Place those 2 indicators (MaksiGen_Range_Move_mtf_3 and i-ParamonWorkTime) to indicator folder of MT5 (for example - to C:\Program Files\MetaTrader 5\MQL5\Indicators)
- Compile indicators in MetaEditor, or restart MT5
- Place template file (maksigen_m1_white_paramon.tpl) to template folder (for example - to C:\Program Files\MetaTrader 5\Profiles\Templates)
- Open M5 chart of selected pair, right mouse click on the chart, select - Templates - [our template by name]
You should get the chart like this :

How to use/trading?
Paramon Trading system is part of MaksiGen trading system so read the following links/posts :
------------------------------
- indicator to download
- some explanation about the system in general how to use
- Trading examples with MT5 statement, more trading is here.
- Paramon trading system iis on this post
In short term situation - just a correction is going on so you should wait for the price to cross MA for example :
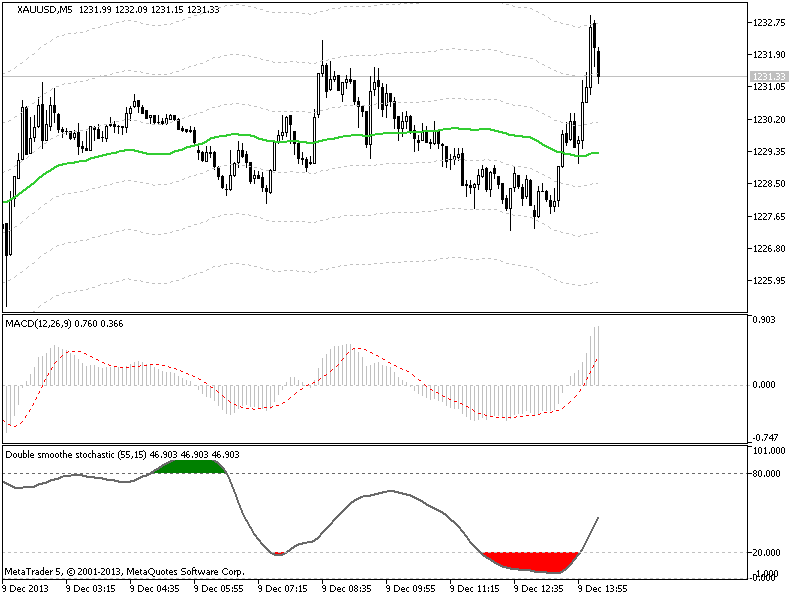
can get the signal with MA 8 and 16?
I like MA periods to be same with fibo figures ...
- Fibonacci retracement
- AutoDayFibs
- Auto Fibonacci Indicator (Auto Fibos)
- Daily_FiboPiv_DK
- FiboPivot_V2
- ZigZag on Parabolic + Fibo + Channel
- ZigZag + Fibo
3 Stoch MaFibo trading system for M5 and M1 timeframe
- trading examples
- template to download
- explanation how to trade and more explanation here
- how to install
- 2stochm_v4 EA is on this post.
Indicators: Fibonacci retracement
newdigital, 2013.11.21 12:06
Fibonacci Retracements (based on stockcharts article)
Introduction
Fibonacci Retracements are ratios used to identify potential reversal levels. These ratios are found in the Fibonacci sequence. The most popular Fibonacci Retracements are 61.8% and 38.2%. Note that 38.2% is often rounded to 38% and 61.8 is rounded to 62%. After an advance, chartists apply Fibonacci ratios to define retracement levels and forecast the extent of a correction or pullback. Fibonacci Retracements can also be applied after a decline to forecast the length of a counter trend bounce. These retracements can be combined with other indicators and price patterns to create an overall strategy.
The Sequence and Ratios
This article is not designed to delve too deep into the mathematical
properties behind the Fibonacci sequence and Golden Ratio. There are
plenty of other sources for this detail. A few basics, however, will
provide the necessary background for the most popular numbers. Leonardo
Pisano Bogollo (1170-1250), an Italian mathematician from Pisa, is
credited with introducing the Fibonacci sequence to the West. It is as
follows:
0, 1, 1, 2, 3, 5, 8, 13, 21, 34, 55, 89, 144, 233, 377, 610……
The sequence extends to infinity and contains many unique mathematical properties.
- After 0 and 1, each number is the sum of the two prior numbers (1+2=3, 2+3=5, 5+8=13 8+13=21 etc…).
- A number divided by the previous number approximates 1.618 (21/13=1.6153, 34/21=1.6190, 55/34=1.6176, 89/55=1.6181). The approximation nears 1.6180 as the numbers increase.
- A number divided by the next highest number approximates .6180 (13/21=.6190, 21/34=.6176, 34/55=.6181, 55/89=.6179 etc….). The approximation nears .6180 as the numbers increase. This is the basis for the 61.8% retracement.
- A number divided by another two places higher approximates .3820 (13/34=.382, 21/55=.3818, 34/89=.3820, 55/=144=3819 etc….). The approximation nears .3820 as the numbers increase. This is the basis for the 38.2% retracement. Also, note that 1 - .618 = .382
- A number divided by another three places higher approximates .2360 (13/55=.2363, 21/89=.2359, 34/144=.2361, 55/233=.2361 etc….). The approximation nears .2360 as the numbers increase. This is the basis for the 23.6% retracement.
1.618 refers to the Golden Ratio or Golden Mean, also called Phi. The inverse of 1.618 is .618. These ratios can be found throughout nature, architecture, art and biology. In his book, Elliott Wave Principle, Robert Prechter quotes William Hoffer from the December 1975 issue of Smithsonian Magazine:
….the proportion of .618034 to 1 is the mathematical basis for the shape of playing cards and the Parthenon, sunflowers and snail shells, Greek vases and the spiral galaxies of outer space. The Greeks based much of their art and architecture upon this proportion. They called it the golden mean.
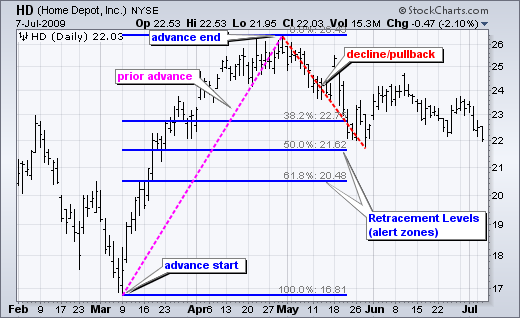
Alert Zones
Retracement levels alert traders or investors of a potential trend
reversal, resistance area or support area. Retracements are based on the
prior move. A bounce is expected to retrace a portion of the prior
decline, while a correction is expected to retrace a portion of the
prior advance. Once a pullback starts, chartists can identify specific
Fibonacci retracement levels for monitoring. As the correction
approaches these retracements, chartists should become more alert for a
potential bullish reversal. Chart 1 shows Home Depot retracing around
50% of its prior advance.
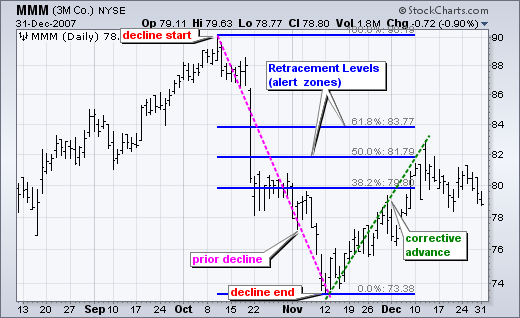
The inverse applies to a bounce or corrective advance after a decline.
Once a bounce begins, chartists can identify specific Fibonacci
retracement levels for monitoring. As the correction approaches these
retracements, chartists should become more alert for a potential bearish
reversal. Chart 2 shows 3M (MMM) retracing around 50% of its prior
decline.
Keep in mind that these retracement levels are not hard reversal points. Instead, they serve as alert zones for a potential reversal. It is at this point that traders should employ other aspects of technical analysis to identify or confirm a reversal. These may include candlesticks, price patterns, momentum oscillators or moving averages.
Common RetracementsThe Fibonacci Retracements Tool at StockCharts shows four common retracements: 23.6%, 38.2%, 50% and 61.8%. From the Fibonacci section above, it is clear that 23.6%, 38.2% and 61.8% stem from ratios found within the Fibonacci sequence. The 50% retracement is not based on a Fibonacci number. Instead, this number stems from Dow Theory's assertion that the Averages often retrace half their prior move.
Based on depth, we can consider a 23.6% retracement to be relatively shallow. Such retracements would be appropriate for flags or short pullbacks. Retracements in the 38.2%-50% range would be considered moderate. Even though deeper, the 61.8% retracement can be referred to as the golden retracement. It is, after all, based on the Golden Ratio.
Shallow retracements occur, but catching these requires a closer watch and quicker trigger finger. The examples below use daily charts covering 3-9 months. Focus will be on moderate retracements (38.2-50%) and golden retracements (61.8%). In addition, these examples will show how to combine retracements with other indicators to confirm a reversal.
Moderate Retracements
Chart 3 shows Target (TGT) with a correction that retraced 38% of the
prior advance. This decline also formed a falling wedge, which is
typical for corrective moves. The combination raised the reversal alert.
Chaikin Money Flow turned positive as the stock surged in late June,
but this first reversal attempt failed. Yes, there will be failures. The
second reversal in mid July was successful. Notice that TGT gapped up,
broke the wedge trend line and Chaikin Money Flow turned positive (green
line).
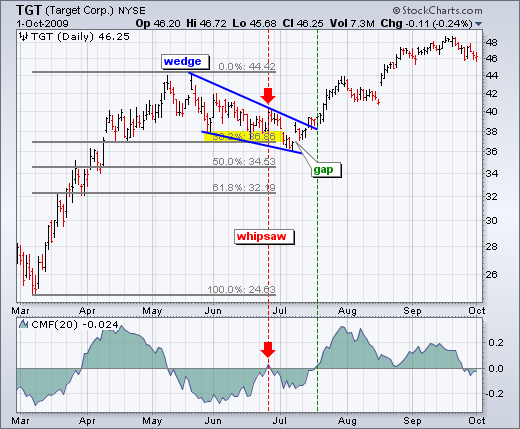
Chart 4 shows Petsmart (PETM) with a moderate 38% retracement and other
signals coming together. After declining in September-October, the stock
bounced back to around 28 in November. In addition to the 38%
retracement, notice that broken support turned into resistance in this
area. The combination served as an alert for a potential reversal.
William %R was trading above -20% and overbought as well. Subsequent
signals affirmed the reversal. First, Williams %R moved back below -20%.
Second, PETM formed a rising flag and broke flag support with a sharp
decline the second week of December.
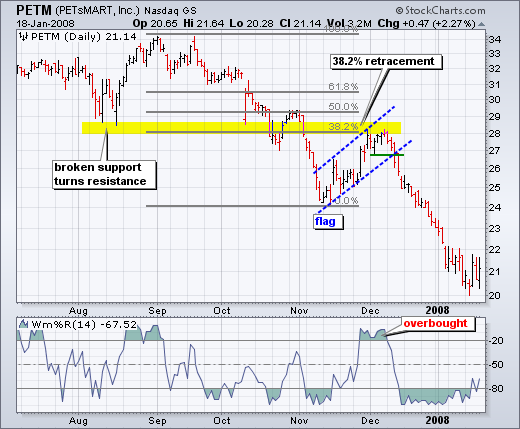
Chart 4 shows Pfizer (PFE) bottoming near the 62% retracement level.
Prior to this successful bounce, there was a failed bounce near the 50%
retracement. The successful reversal occurred with a hammer on high
volume and follow through with a breakout a few days later.
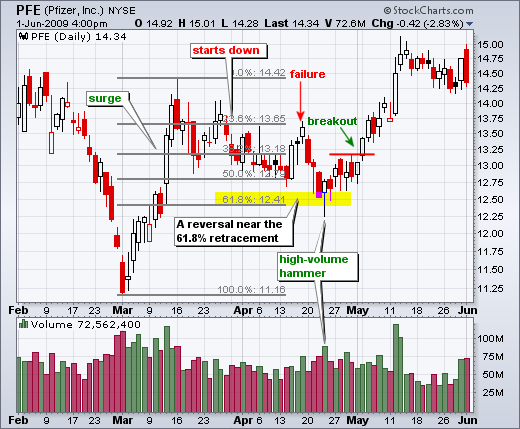
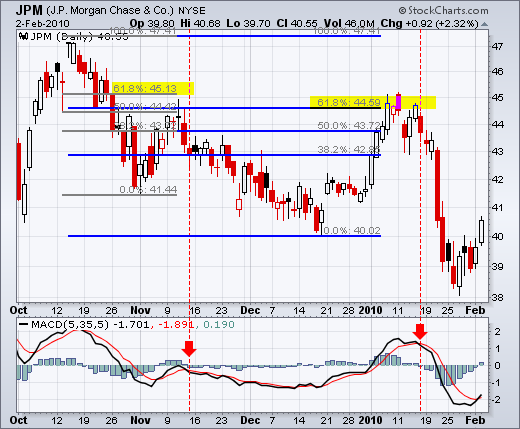
Chart 5 shows JP Morgan (JPM) topping near the 62% retracement level.
The surge to the 62% retracement was quite strong, but resistance
suddenly appeared with a reversal confirmation coming from MACD
(5,35,5). The red candlestick and gap down affirmed resistance near the
62% retracement. There was a two day bounce back above 44.5, but this
bounce quickly failed as MACD moved below its signal line (red dotted
line).
Fibonacci retracements are often used to identify the end of a correction or a counter-trend bounce. Corrections and counter-trend bounces often retrace a portion of the prior move. While short 23.6% retracements do occur, the 38.2-61.8% covers the more possibilities (with 50% in the middle). This zone may seem big, but it is just a reversal alert zone. Other technical signals are needed to confirm a reversal. Reversals can be confirmed with candlesticks, momentum indicators, volume or chart patterns. In fact, the more confirming factors the more robust the signal.
- Free trading apps
- Over 8,000 signals for copying
- Economic news for exploring financial markets
You agree to website policy and terms of use