iCustom doesn't work... - I know how the iCustom Methode works!
UPDATE:
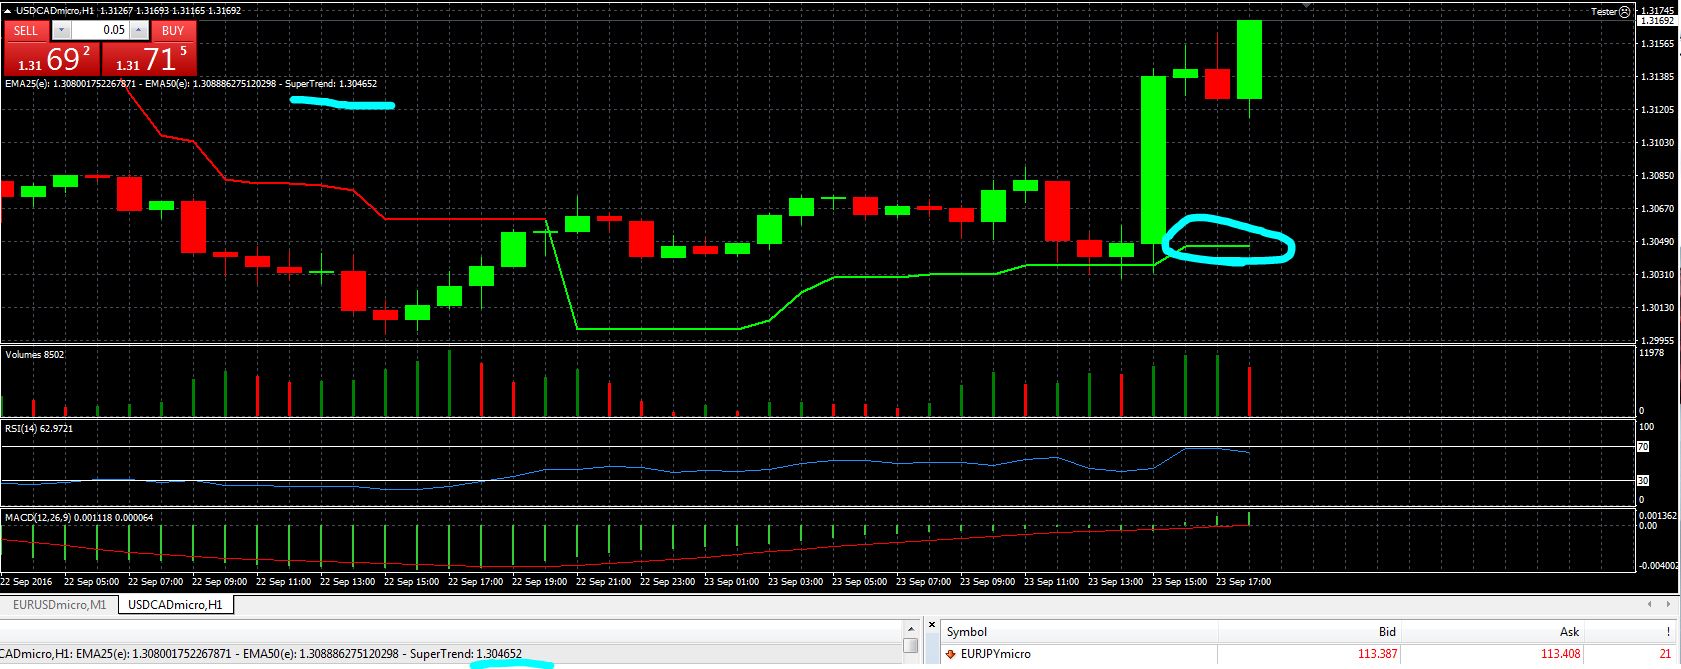
I found out that the EA returns the right value for the SuperTrend if the SuperTrend is below the market price... Why is that working?
So it's only wrong if the SuperTrend is above the market price!
superTrend_lower = iCustom(NULL, 0, "SuperTrend", 10, 3.0, 0, 0);
superTrend_upper = iCustom(NULL, 0, "SuperTrend", 10, 3.0, 1, 0);
2147483647.0 is EMPTY_VALUE, which means that the line is not displayed
   if(superTrend_lower!=EMPTY_VALUE)
     {
      Print("SuperTrend is below price");
     }
   else
     {
      Print("SuperTrend is above price");
     }
.
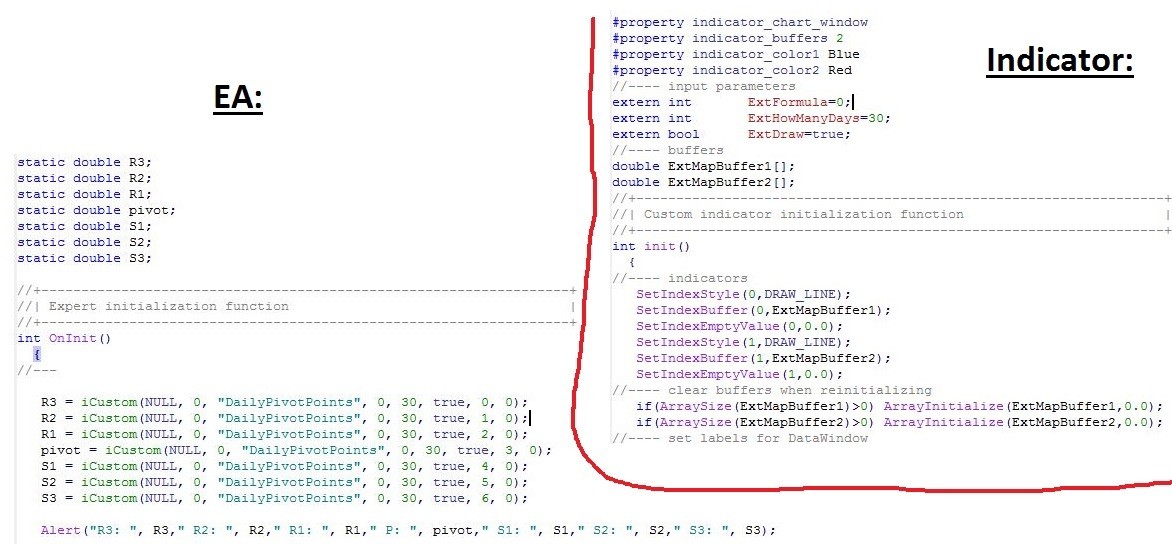
I have again a problem with my iCustom, I think it is again a Buffer error... How can I get the 6 values for the daily pivot points?
You can find the code for the DailyPivotPoints Indicator in the attachment!
I have again a problem with my iCustom, I think it is again a Buffer error... How can I get the 6 values for the daily pivot points?
You can find the code for the DailyPivotPoints Indicator in the attachment!
The indicator "dailypivotpoints" that you have provided, displays the pivot points using Graphical Chart Objects and not standard indicator buffers, therefore you cannot use iCustom() to get the values.
You will have to either:
- Use Graphical Chart Objects manipulation to get the values from the chart objects. Personally however, I consider this is to be the worst solution of the 3 and don't recommend it.
- Code the equivalent calculations in the EA's code itself and not depend on an outside indicator for the pivot values. Since calculating pivot points, is quite simple, this would be my personal choice, but for more complex indicators, the next choice would be more acceptable.
- Code your own indicator that will use buffers to calculate and display the pivot points, and therefore allow the usage of iCustom() to get the data.
The lines are drawn with objects, not buffers, so you cannot access their values with iCustom.
You can get their values with ObjectGet() or ObjectGetDouble() as long as the indicator is attached to the chart.
- Free trading apps
- Over 8,000 signals for copying
- Economic news for exploring financial markets
You agree to website policy and terms of use
Hey Guys,
I can imagine that here in the forum are a lot of threads like these. But my problem this time isn't that I don't know how the iCustom Methode works rather that it doesn't work...
The parameters for the iCustom Methode are:
My Code looks so:
I don't know why but I am getting wrong results... For example the SuperTrend is in the picture 1.12259 but the EA says "SuperTrend: 2147483647.0"
Where is the problem and how can I fix that?
The input parameters for the SuperTrend Indicator are Nbr_Periods and Multiplier. So just 2 parameters who I gave the value 10 and 3.0 (standart values) in my iCustom Methode. But it doesn't work...
You can find the code for the SuperTrend Indicator in the attachment!
Greetings and thank you!