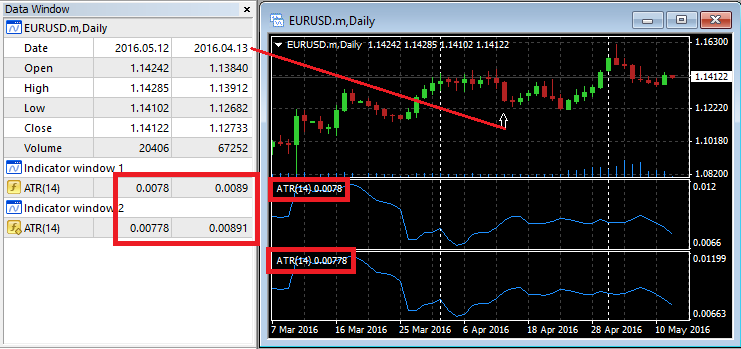
The latest value is usually displayed at the top-left of the indicator window (just as GumRai stated) but it is also available on the "Data Window", which also allows you to see the exact value for other bars on which you place your mouse cursor.
I have attached a screen shot which includes both the Built-In "Average True Range" Indicator which only shows 4 digits, as well as the Example (from MetaQuotes) "ATR" Indicator which shows 5 digits.

Yes, i see, thank you but its inconvenient to have to look at the other side of the screen.. or looking in a data table. Just like missing shortkeys for drawing tools... This platform needs a new software designer ;P
Well, if its inconvenient, then just place the mouse over the a particular point in the ATR graph and a tool-tip popup window tells you the value at that point. You don't even need to call the cross-hairs to this, not even on the main window for OHLC values.
I really don't see what you are complaining about.
hey.
sorry for bump a kind of an old post, but i'm googling for that, because is really good to not to force the ocular muscle (wich increases the lower levels of anxiety in a work like trading this is relevant) to match lines of the level values and the indicator to know exactly if we are at 49.5 or 51 MFI.
This is totally relevant to get in time into a trade on a multiframe sto+rsi strategy for example, like i do,
when i have a signal to enter a position on 15M, i have to be prepared to the confirm the signal on 30M just at the start of the next 15M period start
if its confirmated by checking the evolution of MFI Macd, volumes and so, i want to know the exact values of market conditions to figure out confirmation in around 15-30secs maximum, because automated systems working with this kind of strategy get trigered, and many other fast traders ofc.
so i dont have at all time to check overall values with relative levels on a graph, i need exact values and fast to confirm market condition under 30 sec to not lose 5-10 pip because my strategy can spot 12 to 18 pip movements, with nowdays maret conditions, and
if i'm not fast i only get 50%-60% of the total profit of my signal.
so if anyone know how to do that, i would like to do this a lot, because i'm used to check trend overall direction with RSI(14)MA(9) at 30M on trading central reports, and they have that values on their indicator because on this indicator most of the time this 2 lines are very close to each other and divergences wider than 0.5 matters.
bb and thx.- Free trading apps
- Over 8,000 signals for copying
- Economic news for exploring financial markets
You agree to website policy and terms of use
Simple question here regarding the ATR indicator: I feel a little handicapped this way. I want to see the exact value.. not just guessing.
I do not want to grab the cross all the time to check. It will take to much time and makes me entering a trade to late.
I need that value because i base my stop-loss / target price ranges on this indicator. I know I could code in a horizontal line with the current value but it then I don't want the line, just the price. When i make the line black, the price label also gets black and unreadable.
Is there a special setting to allow indicator buffers to draw their value on the right axis?