Color the background?
What you see is a transparent polygon which needs 4 anchors. The normal chart objects support up to two anchors whereby pseudo transparency is not a problem, but the 4 anchors are. There are two ways:
1. Define four buffers in an indicator using OBJ_TREND, first and second show the lines as solid lines, third and fourth use a pattern. This will produce a look which is at least similar. Please search for ObjectSetInteger and line styles.
2. Get used to the CCanvas class and chart events as well as CChart. With this, you can do anything you want, but its not done just like that, its a bigger piece of work. But fact is, it can be done, definitely.
And at least I just need 3 anchors!
Because the other line ist already drawn! (It's a pivot!) - But I must use solid line in both directions!
Sometimes she is below or sometimes she is above! - So maybe I need at least though 4 anchors
You´re welcome. But I was mistaking. OBJ_TREND works of course not with buffers. Instead you have to define the points of the line yourself, but that should not be such a big deal. I think these bands are a good point to start:
#property indicator_chart_window
#property indicator_buffers 4
#property indicator_color1 C'240,192,192'
#property indicator_color2 C'192,240,192'
#property indicator_color3 clrRed
#property indicator_color4 clrBlue
#property indicator_width1 5
#property indicator_width2 5
#property indicator_width3 2
#property indicator_width4 2

extern int                  MA1Period=21;
extern ENUM_MA_METHOD       MA1Method=MODE_EMA;
extern ENUM_APPLIED_PRICE   MA1Price =PRICE_CLOSE;
extern int                  MA2Period=50;
extern ENUM_MA_METHOD       MA2Method=MODE_SMA;
extern ENUM_APPLIED_PRICE   MA2Price =PRICE_CLOSE;


double buffer0[];
double buffer1[];
double buffer2[];
double buffer3[];


int OnInit()
{
   SetIndexBuffer(0,buffer0);
   SetIndexBuffer(1,buffer1);
   SetIndexBuffer(2,buffer2);
   SetIndexBuffer(3,buffer3);
   SetIndexStyle(0,DRAW_HISTOGRAM);
   SetIndexStyle(1,DRAW_HISTOGRAM);
   return(INIT_SUCCEEDED);
}

int start()
{
   int counted_bars=IndicatorCounted();
   int limit,i;

   if(counted_bars<0) return(-1);
   if(counted_bars>0) counted_bars--;
           limit=Bars-counted_bars;

   for(i=limit-1; i>=0; i--)
   {
      buffer0[i] = iMA(NULL,0,MA1Period,0,MA1Method,MA1Price,i);
      buffer1[i] = iMA(NULL,0,MA2Period,0,MA2Method,MA2Price,i);
      buffer2[i] = buffer0[i];
      buffer3[i] = buffer1[i];
   }
   return(0);
}
Your MetaTrader4 look very nice man!
Thank you a lot! - But I have two questions at least.
I just need the colored background in a few straights. How can I do that? - For example from 1.120-1.121. This area should be colored.
And the second question is, how can I use that in for my Expert Advisor. I need to call it from the iCustome function! - How does it works?
- Free trading apps
- Over 8,000 signals for copying
- Economic news for exploring financial markets
You agree to website policy and terms of use
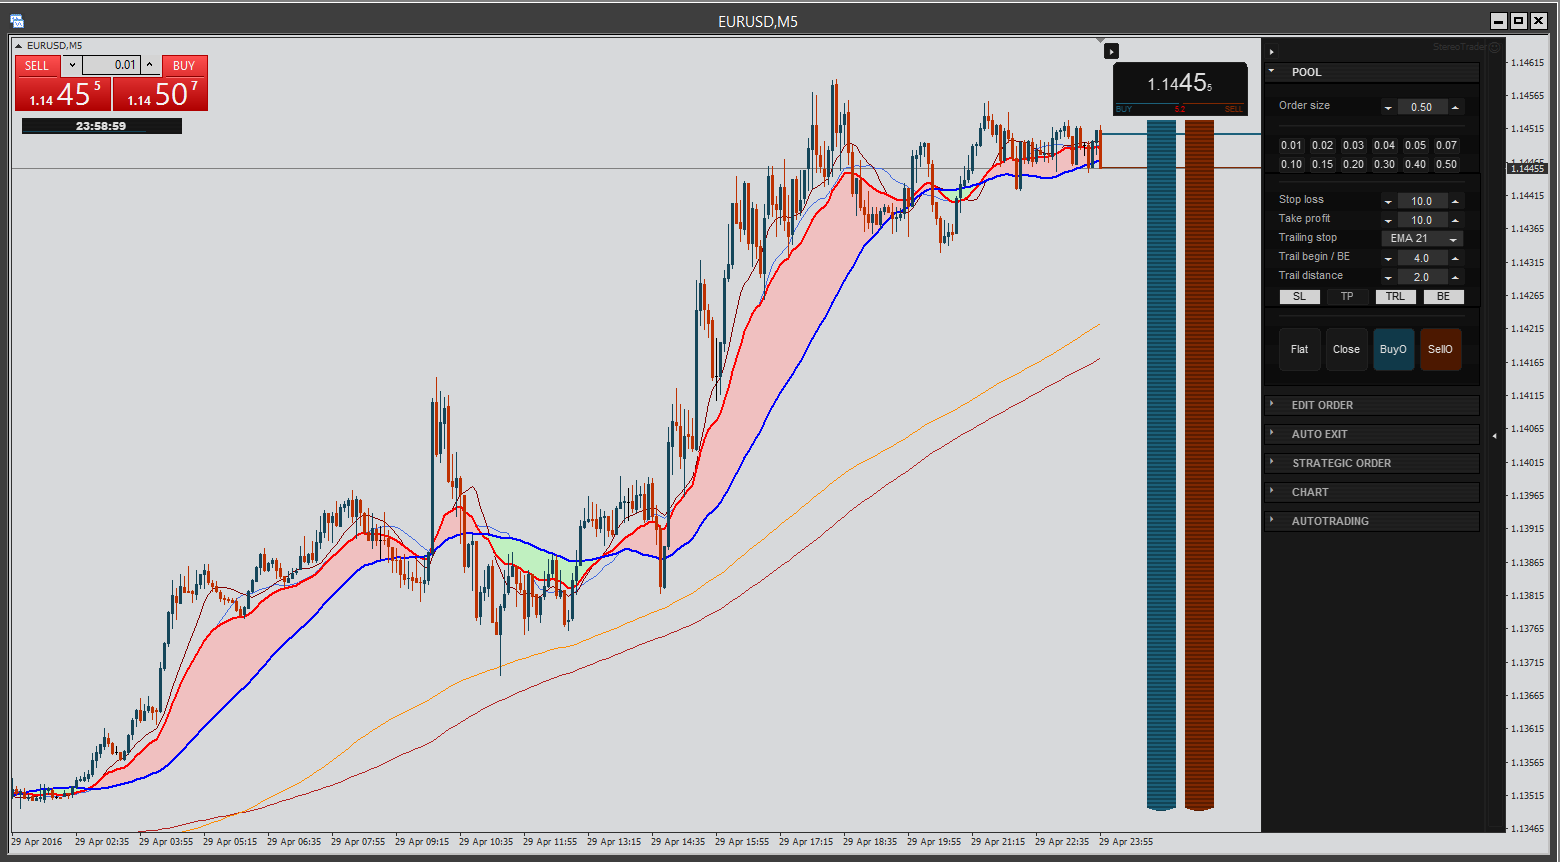
Hey Guys,
I'm actually writting my own Expert Advisor and want to draw something in the chart. Is there any option to do that, like in the picture below?
I know, that there is the possibility to draw a channel in the chart. But I think, this channel doesn't looks so good like the channel in the picture above!
Greetings and Thank You!